MAR HEATING OIL
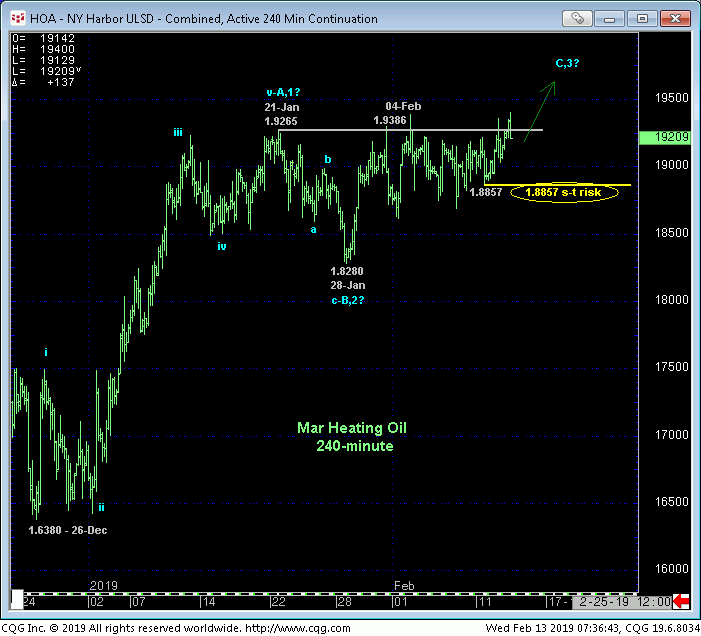
This morning’s eke above the past three weeks’ 1.9265-to-19386-area resistance, in fact, reinstates the uptrend from 26-Dec’s 1.6380 low. This resumed, albeit excruciatingly grudging rally leaves a litany of recent minor corrective lows starting with 11-Feb’s 1.8857 low that we would expect the market to sustain gains above IF today’s poke is part of a broader bullish count. Former 1.92-handle-area resistance would be expected to hold as new support. Per such, we are identifying 1.8857 as our new short-term risk parameter to a still-advised but cautious bullish policy.
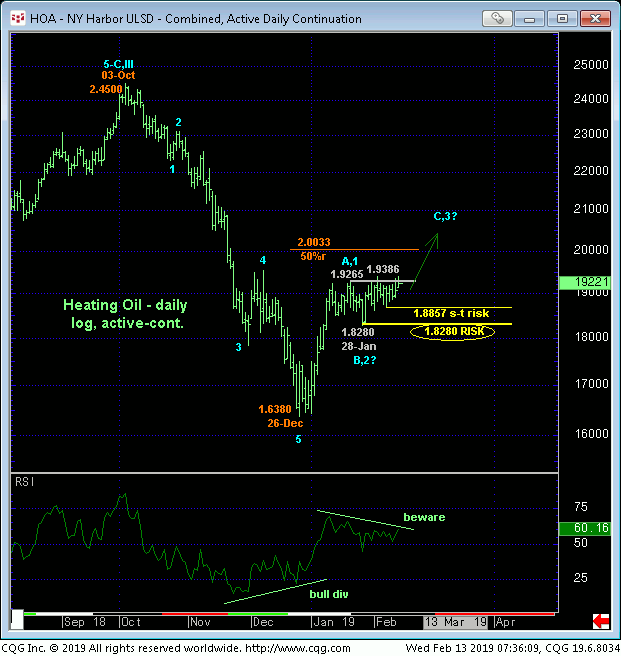
The market’s very labored gains over the past few weeks has resulted in the developing POTENTIAL for a bearish divergence in daily momentum below. A failure below 1.857 would raise the odds that the broader rally from the Dec low is rolling over while commensurately larger-degree weakness below 28-Jan’s 1.8280 larger-degree corrective low and key risk parameter will CONFIRM it to the point of non-bullish action by even longer-term players. Until and unless such weakness is shown, we’ve got to respect the market’s upside potential.
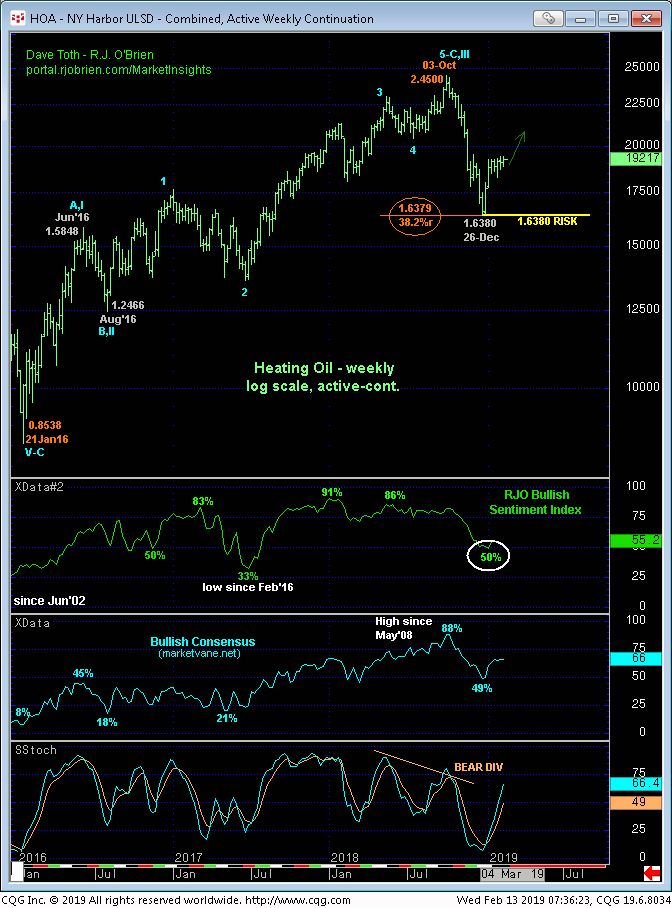
As discussed for weeks:
- Jan’s bullish divergence in momentum amidst
- historically bearish sentiment levels and
- a complete 5-wave Elliott sequence down from 03-Oct’s 2.4500 high and
- the market’s acknowledgement/rejection of the exact (1.6379) 50% retrace of Jan’16 – Oct’18’s entire 0.8538 – 2.4500 rally on a weekly log scale basis below
provide a compelling combination of technical facts warning of a base/reversal environment that could be major in scope. The market hasn’t yet provided the price action needed to negate the initial counter-trend rally thus far, highlighting the 1.8857 and 1.8280 risk parameters discussed above. Per such, a bullish policy and exposure remain advised with weakness below these levels required to pare or neutralize bullish exposure commensurate with one’s personal risk profile. These levels may come in handy given a more significant threat to crude oil’s Dec-Feb rally and the generally positive correlation between these two markets.
MAR CRUDE OIL
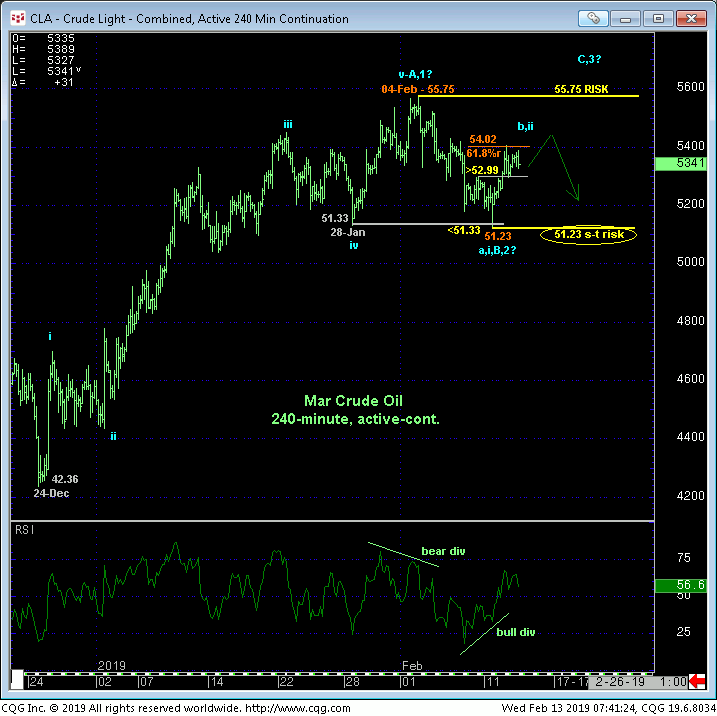
Contrary to the heating oil analysis above, Mon’s failure below 28-Jan’s 51.33 corrective low CONFIRMED a bearish divergence in daily momentum, BROKE Dec-Feb’s uptrend and defined 04-Feb’s 55.75 high as the end of a textbook 5-wave Elliott sequence as labeled in the 240-min chart above. These facts warrant proof of resumed strength above 55.75 and our new key risk parameter to negate this peak/reversal-threat count and reinstate the bull ahead of what could be sharp gains.
From a shorter-term perspective however, the 240-min chart above shows a minor bullish divergence in mo yesterday above 52.99 that stemmed early-Feb’s setback at 51.23 that identifies that low as an objective risk parameter from which non-bearish decisions like short-covers and cautious bullish puints can now be objectively based and managed. In effect the market has identified 55.75 and 51.23 as the rather obvious directional triggers heading forward.
With respect to a peak/correction/reversal-threat count, it is interesting to note that this week’s recovery thus far has stalled around the (54.02) 61.8% retrace of the 55.75 – 51.23 break.
A recovery above 55.75 will no doubt be consistent with the bullish count discussed above for diesel. By the same token a relapse below 51.23 amidst very labored bullish behavior in heating oil is likely to mean a diesel failure and larger-degree correction lower. So which market is right? Which one is leading the other. We know they aren’t going to trend in opposite directions. We believe the most objective path to take is to abide by the specific risk parameters identified in each market.
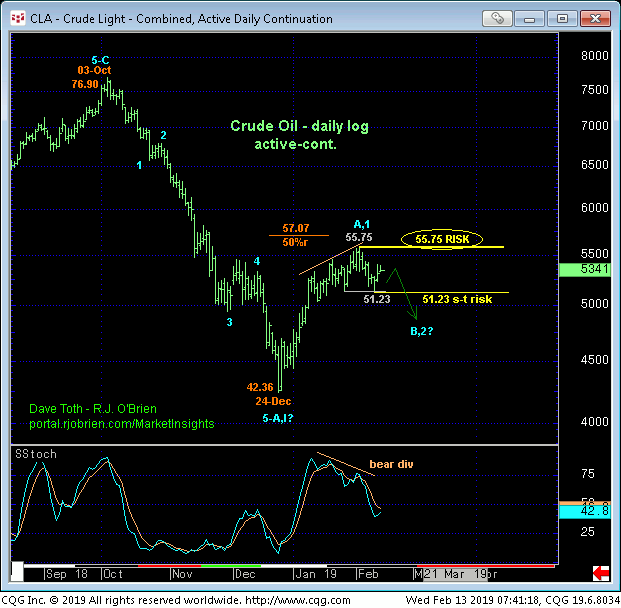
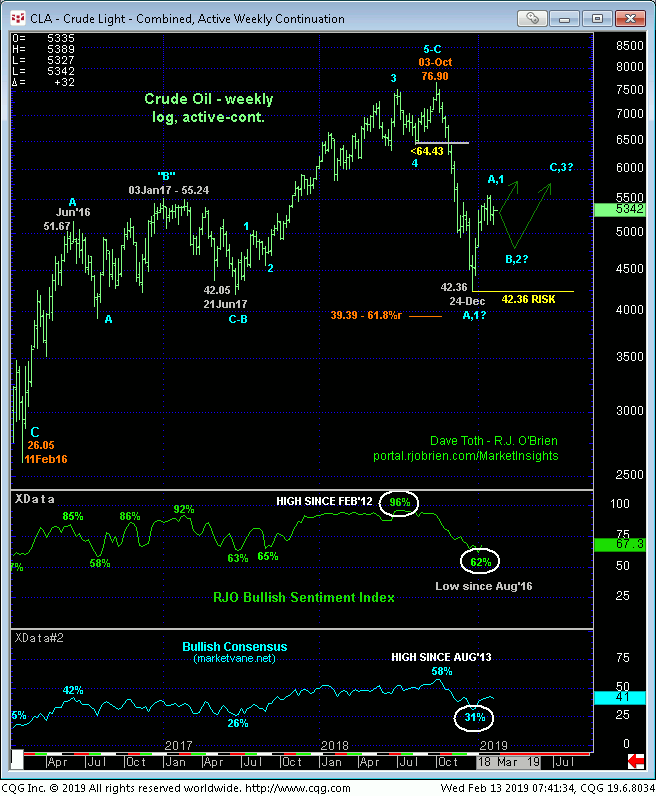
These issues considered, a neutral-to-cautiously-bearish policy is advised for crude oil traders with a recovery above 55.75 required to negate this count, warrant its cover and transition back to the bullish policy in accordance to what we still believe is a major base/reversal process from Dec’s 42.36 low. In lieu of such 55.75+ strength and especially following a failure below 51.23, traders should not be surprised by a more a protracted, if corrective rebuttal to Dec-Feb’s rally.
