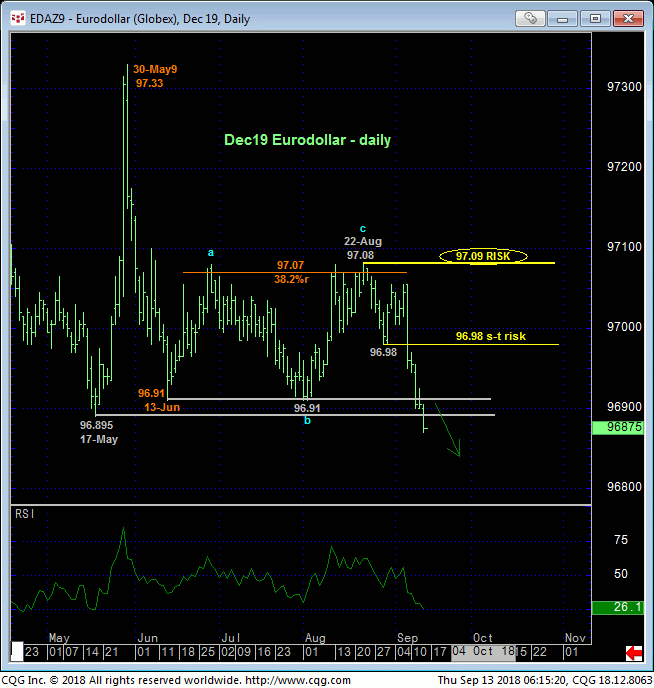
Overnight’s break below the past four months’ 96.89/.91-area lows and support in the Dec19 Eurodollar contract reinstates the secular bear trend from Jun’16’s 98.905 contract high and produces the lowest prices since Nov 2014. This resumed weakness obviously reinforces our preferred bearish count and exposure recommended in 24-Aug’s Trading Strategies Blog as the entire recovery attempt from 13-Jun’s 96.91 low to 22-Aug’s 97.08 high is a clear, textbook 3-wave correction that warned of a resumption of the secular bear trend that preceded it.
Former 96.91-area support is expected to hold as our new near-term resistance candidate. Per any more immediate bearish count “down here”, we would not expect the market to be able to recover above 29-Aug’s suspected minor 1st-Wave low at 96.98, so this level is considered our new short-term risk parameter to which shorter-term traders with tighter risk profiles can objectively rebase and manage the risk of a still-advised bearish policy. From a longer-term perspective fitting of a secular bear trend, we’re defining 97.09 as our new long-term risk parameter to a still-advised bearish policy and exposure for longer-term players.
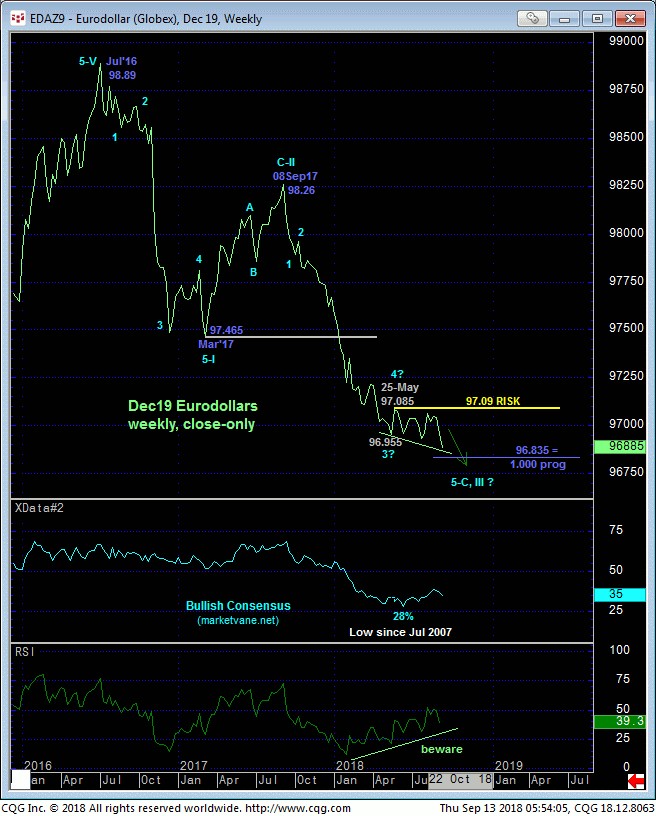
The weekly close-only chart shows waning downside momentum over the past few months that cannot be ignored as a warning that the bear may be running out of steam. But if this is the case, then somewhere along the line the market needs to PROVE “non-weakness” via a recovery above a corrective high like 97.08. Until and unless such strength is proven, and given NO levels of any technical merit below the market, there’s no way to know today’s new 27-MONTH lows won’t lead to an ACCELERATED MELTDOWN straight away.
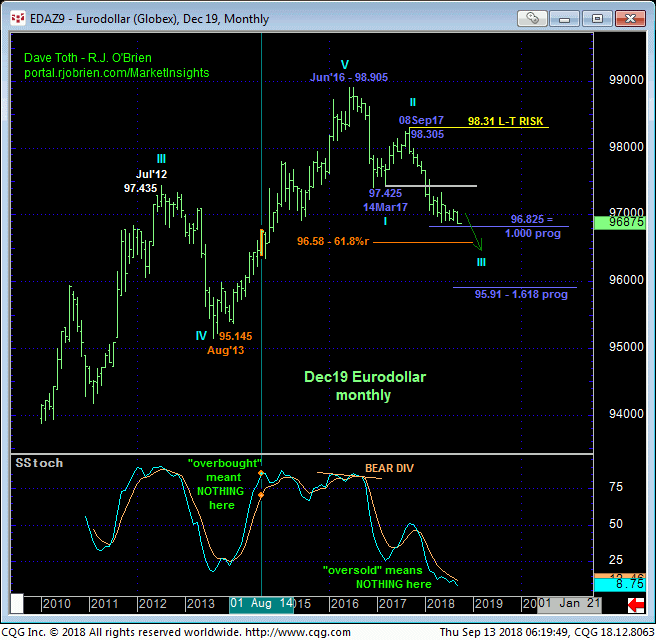
Sure, it’s easy to find “derived” levels like the 1.000 progression of 2016-17’s initial 98.905 – 97.425 decline from Sep’17’s 98.305 high, but only an accompanying confirmed bullish divergence in momentum will render this or any other derived level worthy of support and a base/correction/reversal threat. And this requires a recovery above a prior corrective high like 97.08. This goes for EVERY merely derived level below the market, from Bollinger Bands to imokus to the ever-useless moving averages as the derived level “tail” never, ever wags the underlying market “dog”. It’s the other way around; every momentum indicator is a FUNCTION OF the market.
The same thing applies to momentum and any thoughts that this market is “oversold” simply because the stochastics are flirting around 9.00. This market is no more “oversold” now than it was “overbought” in Aug 2014 before it tacked on another 230 basis points and nearly two years to the uptrend.
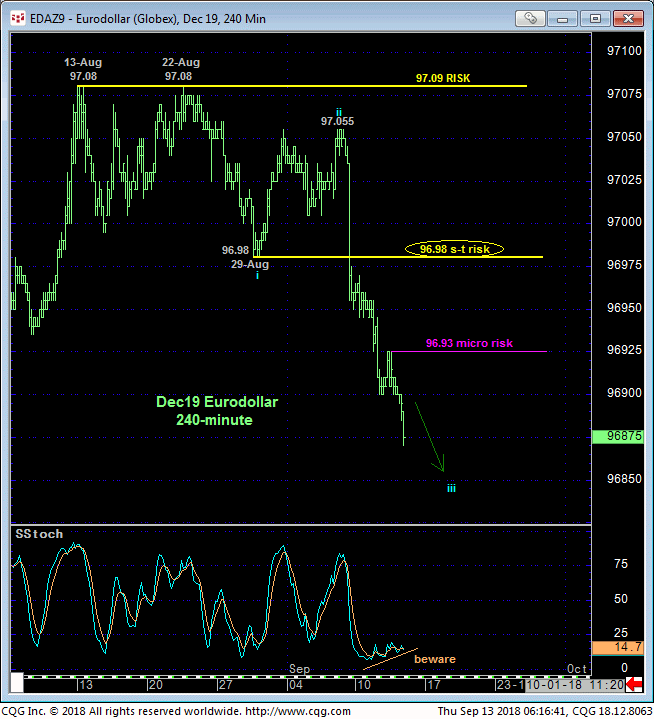
For those needing or wanting to play a bearish position close-to-the-vest, the 240-min chart below shows today’s continued losses leaving overnight’s 96.925 high in its wake as the absolute tiniest corrective high the market is required to recoup to even defer, let alone threaten the bear. Per such, 96.93 may be used as a micro risk parameter to protect a bearish position.
In sum, a full and aggressive bearish policy and exposure remain advised with a recovery above at least 96.98 and preferably 97.09 required to take defensive action commensurate with one’s personal risk profile. In lieu of such strength further and possibly long-lived losses should not surprise as the secular bear trend- that could span a generation- has resumed.
