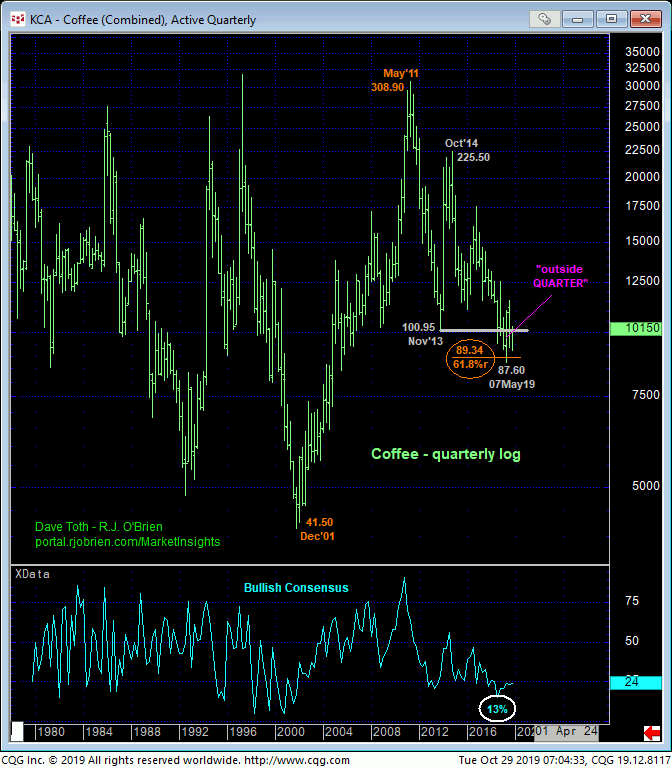
The past few days’ continued rebound above 22-Oct’s 99.10 high leaves Fri’s 95.65 ow in its wake as the latest smaller-degree corrective low the market now needs to sustain gains above to maintain a more immediate, if intra-range bullish count. Its failure to do so will confirm a bearish divergence in short-term momentum, stem the rebound and tilt the longer-term directional scales lower. Per such this 95.65 level is considered our new short-term risk parameter from which an interim cautious bullish policy introduced in 22-Oct’s Technical Blog may be objectively rebased and managed.
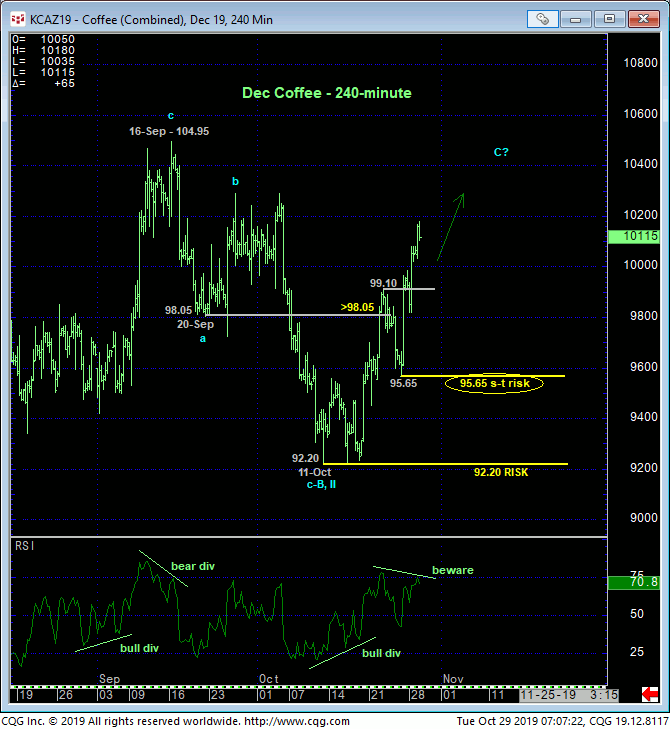
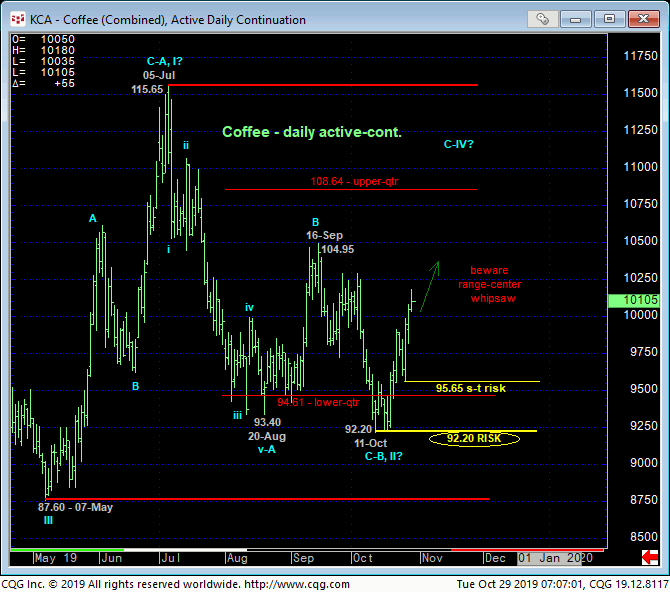
From an intermediate-term perspective, the daily (above) and weekly log (below) charts show the market’s return to the middle of the middle-half bowels of this year’s entire range. The intermediate-term trend is clearly up and will be expected to continue until and unless the market fails below 95.65. This is an easy call. What’s not easy is determining whether the price action from 07-May’s 87.60 low is merely corrective/consolidative ahead of an eventual resumption of the secular bear trend OR the early stages of a base/reversal process that could be massive in scope.
Reinforcing a bullish bias, a least for the time being are the following facts:
- the market’s rejection (again) of the lower-quarter of this year’s range amidst
- historically bearish sentiment/contrary opinion levels and
- only a 3-wave decline from 05-Jul’s 115.65 high to 11-Oct’s 92.20 low.
Left unaltered by a relapse below this 92.20 low and key long-term risk parameter, this 3-wave sell-off attempt is considered a (B- or 2nd-Wave) correction that warns of a (C- or 3rd-Wave) resumption of May-Jul’s rally. Whether the rally from 92.20 is the C-Wave of a correction within the secular bear trend OR the dramatic 3rd-Wave of a major reversal higher is indeterminable at this juncture. Even a breakout above 05-Jul’s 115.65 won’t necessarily negate a bear market correction count. HOWEVER, until and unless this market weakens below 92.20, even the objective prospect of a 3rd-Wave reversal higher warrants serious, if conservative consideration due to the almost incomprehensible risk/reward merits of such a count as levels potentially waaaaaay beyond 116 would be expected.
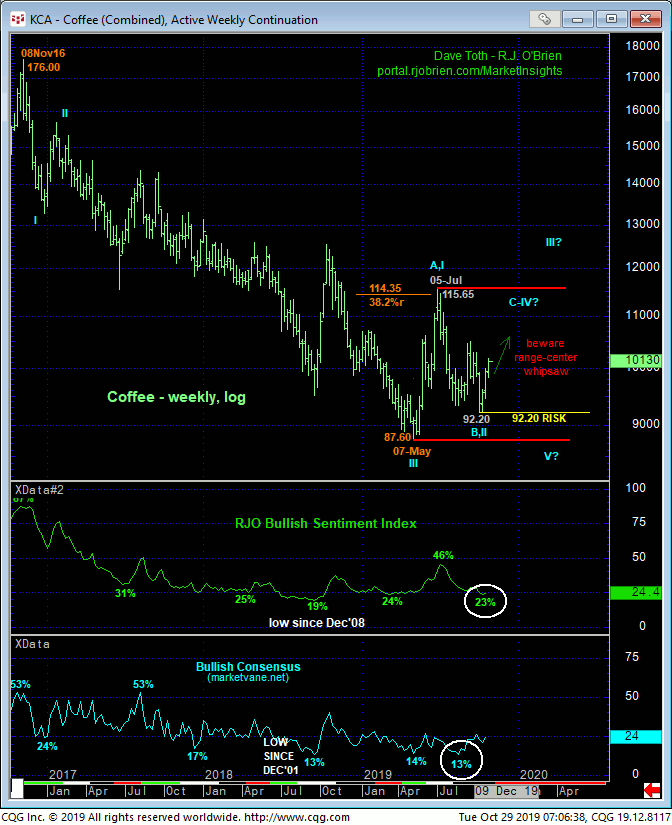
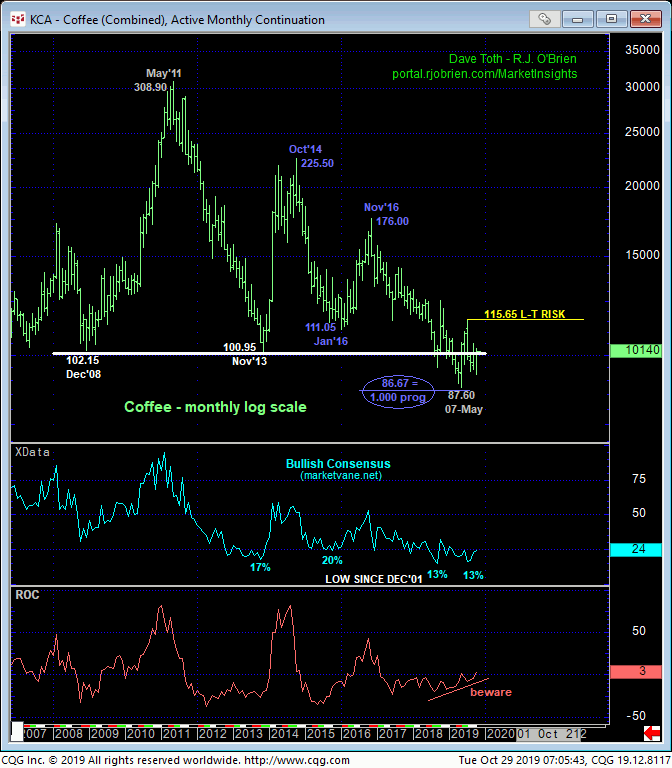
From an even longer-term, historic perspective, the monthly (above) and quarterly (below) log scale charts provide some compelling evidence to a major base/reversal count:
- waning downside momentum (divergence CONFIRMED above Jul’s 115.65 high)
- the bear’s failure to make any headway after breaking more than 10 years’ support around the 102-to-100-area
- historically bearish sentiment
- the Fibonacci fact that the decline from Nov’16’s 176.00 high is virtually identical (i.e. 1.000 progression) to Oct’14 – Jan’16’s preceding 225.50 – 111.05 decline
- the market’s rejection thus far of the area around the (89.34) 61.8% retrace of 2001 – 2011’s secular bull market from 41.50 to 308.90
- 2Q19’s “outside QUARTER up” (higher high, lower low and higher close than 1Q19’s range and close.
To be sure, this market has been an absolute dog for at least FIVE YEARS and, in fact, has been in a secular bear trend since May 2011. It would be grossly premature to conclude anything more than another interim, intra-range corrective hiccup as a result of the past couple weeks’ pop or even the past five months’ non-downtrending behavior. But until and unless this market weakens below at least 95.65 and preferably 92.20, it would also be short-sighted to ignore the prospect for what would be a monumental base/reversal-threat environment.
We are not for a minute suggesting to bet on a 116+ breakout from the current middle-half bowels of this year’s range. Indeed, an intra-range recovery-countering bearish divergence in mo from the upper-quarter of this year’s range after a spike in the sentiment indicators could easily reinforce a secular bearish count to eventual sub-87 levels. What we ARE suggesting is that a cautious bullish bias and exposure remain objective with weakness below at least 95.65 required to defer or threaten this call and subsequent weakness below 92.20 to negate it altogether. And until such weakness is proven, the market’s upside potential is indeterminable and potentially shocking.
