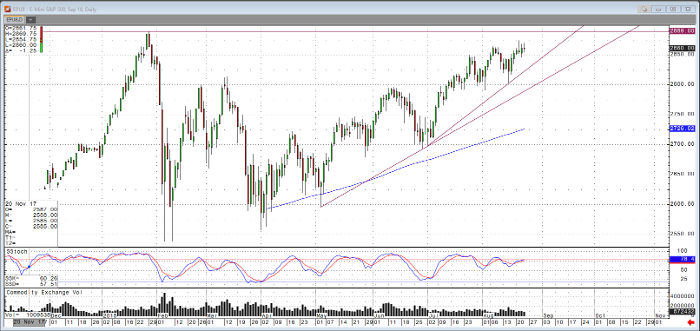
As of Thursday afternoon, the September E-mini S&P 500 contract has traded a tick below 2870 as the contract is nearing its January 29 high less than 15 points away at 2889. As some traders treat former resistance as new support, interest will be piqued should the market trade above the previous high. Another question on the mind of market participants will be if the level continues to act as resistance since the previous high preceded some of the biggest down days of the year.
Levels such as this represent an interesting time for speculators and hedgers alike. For those long stocks amid one of the longer bull markets, it begs the question: will things continue onward and upward, or will there be another repeat of late January and early February? Those looking for a break of the previous high and/or the trendline support pictured below may prefer to position with an options spread or combination of futures and options on futures.
As fate would have it, the previously mentioned high level and trendline support intersection meet near the expiration date for September options. There are also weekly options on the contract as well. To setup a trade using this information or to discuss any aspect of your trading, the markets, our services and any way I may be able to assist you, please contact me at your convenience.
E-mini S&P 500 Sep ’18 Daily Chart


