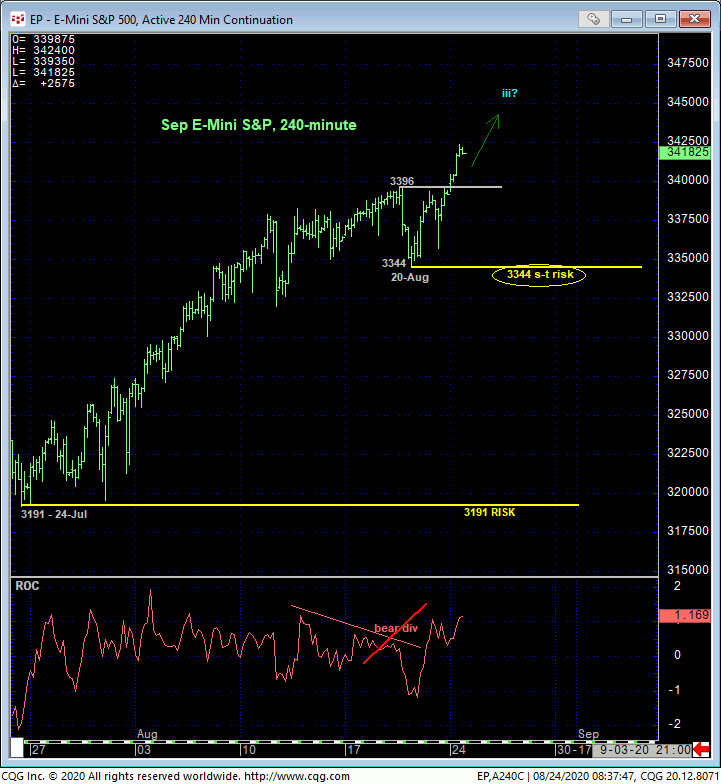
Today’s break above last week’s 3396 high and micro risk parameter nullifies the bearish divergence in very short-term momentum and leaves Thur’s 3344 low in its wake as the latest smaller-degree corrective low the market is now minimally required to fail below to even defer, let alone threaten the bull. Per such, this 3344 level is considered our new short-term risk parameter from which shorter-term traders with tighter risk profiles can objectively rebase and manage the risk of a still-advised bullish policy and exposure.


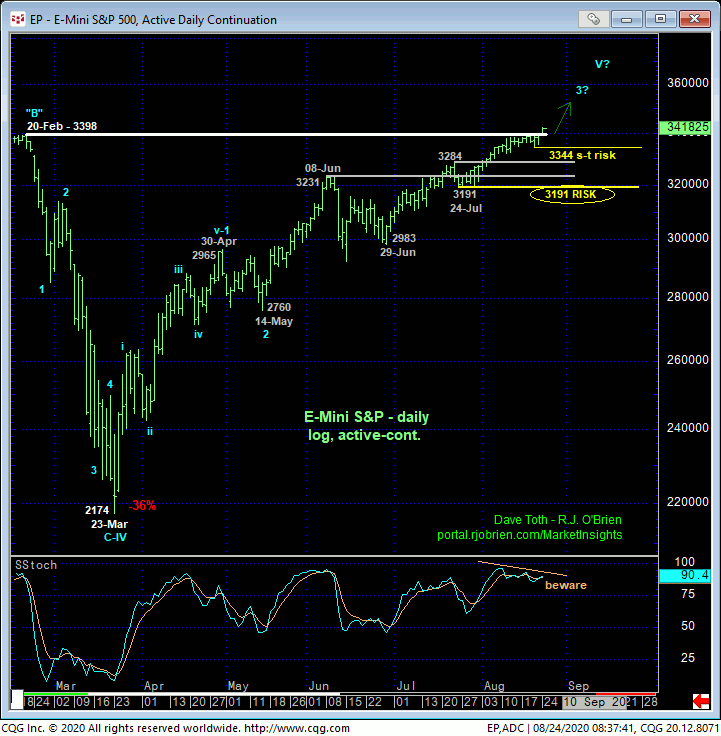
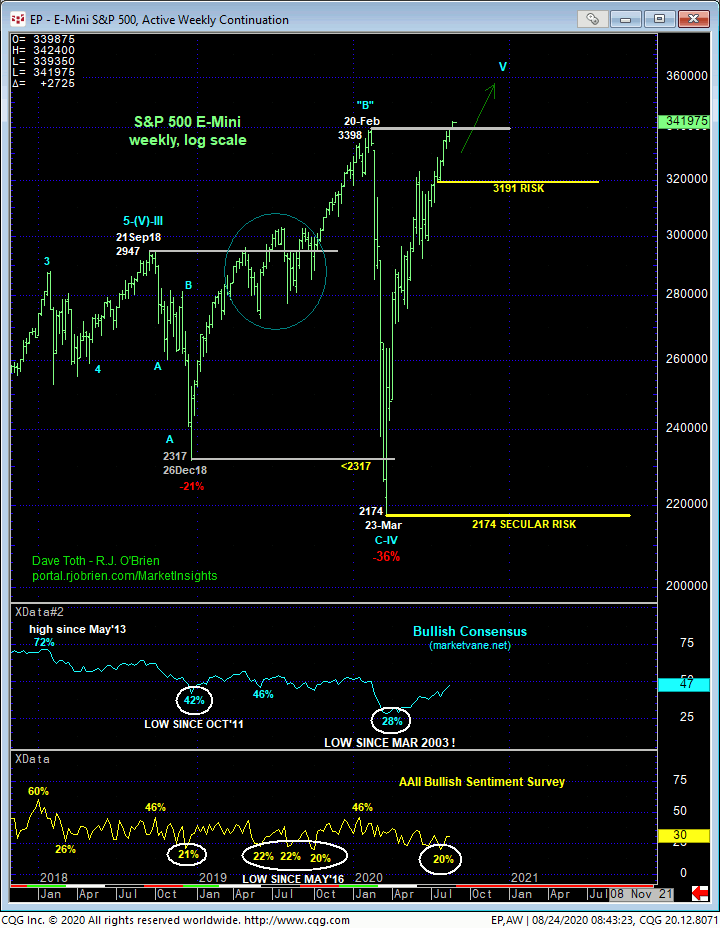
Most importantly, today’s strength in the E-Mini S&P contract (as opposed to the underlying S&P 500 Index) FINALLY breaks 20Feb20’s 3398 previous all-time high, confirming Feb-Mar’s meltdown as part of a corrective/consolidative structure that we believe actually began from 21Sep18’s 2947 as labeled in the weekly log chart below. The secular bull market has resumed, exposing further and possibly accelerated gains straight away with commensurately larger-degree weakness below 24-Jul’s 3191 next larger-degree corrective low and key long-term risk parameter required to confirm a bearish divergence in momentum of a scale sufficient to break even Jun-Aug’s portion f the bull, let alone this year’s major reversal from 23-Mar’s 2174 low. This said and despite the resumption of the secular bull market, this does not necessarily mean the bullish path forward will be an easy, uninterrupted one. Traders are directed to the area circled in blue in the weekly chart below where, following late-Apr’19’s resumption of the secular bull trend above 21Sep18’s prior all-time high at 2947, the market went through a challenging rising-wedge-type pattern for SIX MONTHS before the bull took off in a 4-month, 13% spike. Indeed, if we’re supposed to remain long and bullish “up here”, it’s incumbent on the bull to continue to behave like one with continued trendy, impulsive, sustained gains straight away. A failure below 3344 won’t necessarily derail the bull, but a failure below 3191 will, exposing a larger-degree correction/deferral of the bull. Until and unless such specific and objective weakness is proven however, the trend is up on all scales and should not surprise by its continuance or acceleration with indeterminable upside potential.

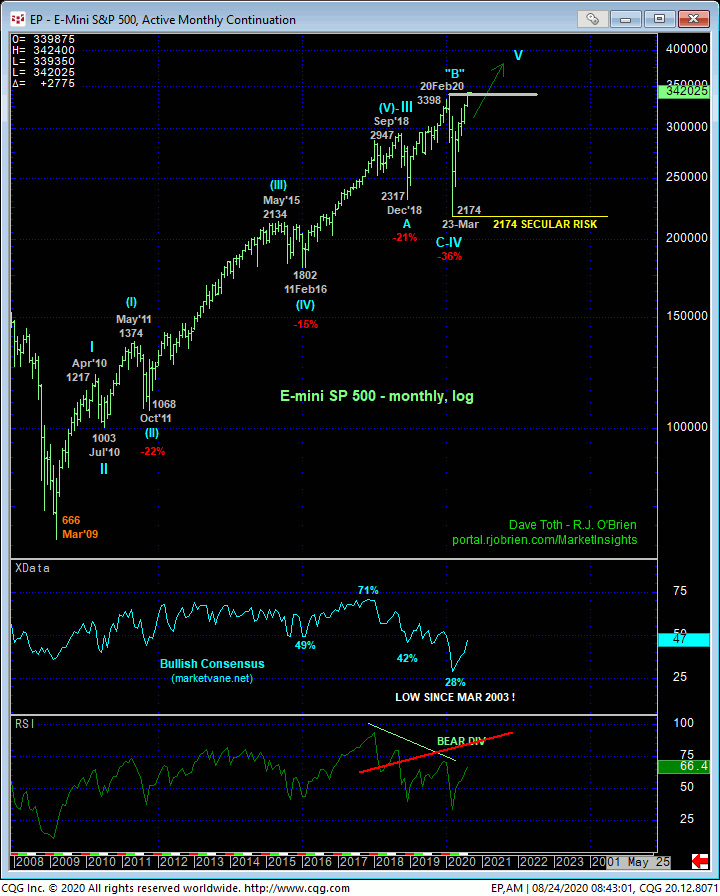
The monthly log chart below shows today’s resumption of a secular bull market that dates from Mar’09’s 666 low. Might the rally from 23-Mar’s 2174 low be the completing 5th-Wave of a sequence that would be massive in scope and warn of an equally massive peak/reversal process? Sure. But until and unless this market 1) fails below at least 3191 and 2) shy of breaking Mar’s 2174 major corrective low and secular risk parameter, puts in protracted peaking/reversal behavior that could span months, such a 5th-wave’s upside potential is indeterminable and potentially severe. To say this market won’t or can’t go straight to 4,000 would be a subjective assessment outside the bounds of technical discipline.
In sum, a full and aggressive bullish policy and exposure remain advised with a failure below 3344 required for shorter-term traders to step aside and commensurately larger-degree weakness below 3191 for long-term players to follow suit. In lieu of such weakness, further and possibly accelerated gains straight away should not surprise.


