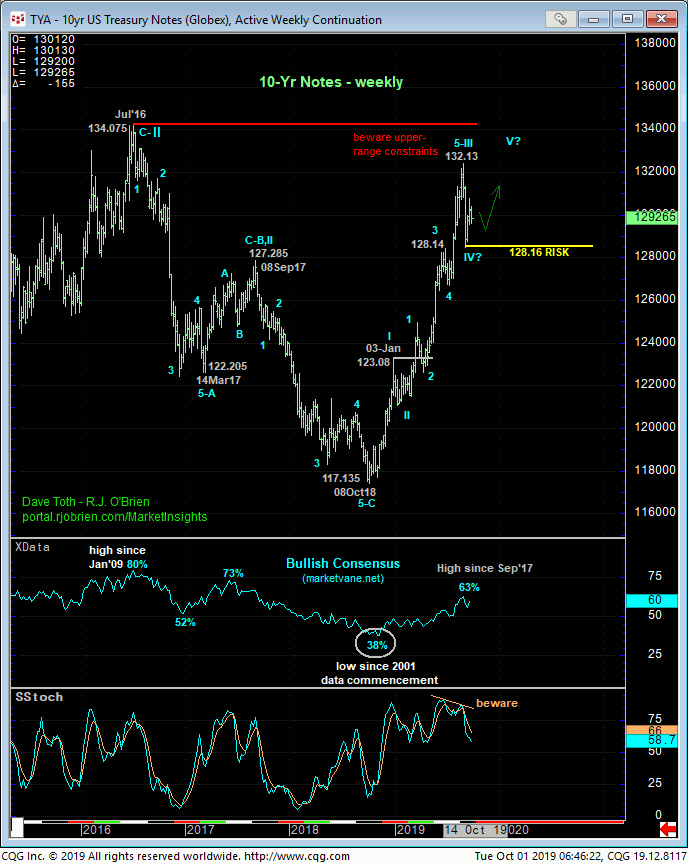
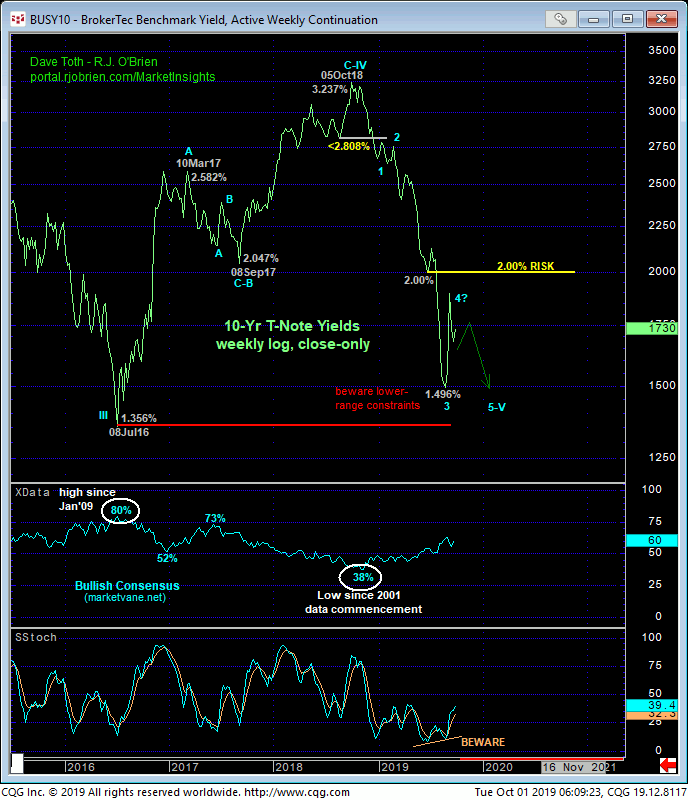
As the market is closing in on its 1-yr anniversary next week, we can look back at a rally that’s been about as orderly as it gets, with shallow, non-threatening corrective dips along the way that made this bull one of the easier ones to ride (well, easier relative to corrective/consolidative and reversal environments). But now that the contract has approached its Jul’16 134.075 contract high and rates have come close to Jul16’s 1.35% low (30-yr rates actually broke their Jul’16 2.085% low), it should come as little surprise that the going’s gonna get a little tougher for the bull around these historic 2016 levels.
Whether relapses in the contract and rebounds in rates are merely corrective/consolidative within the still-unfolding secular bull trend OR the start of a broader peak/reversal process remains to be seen. But in either event, we believe the trendier, impulsive and, frankly, easier price action is likely behind us for a while. The combination of waning upside momentum so near to 2016’s high amidst historically frothy bullish sentiment levels shown in the weekly chart above is hard to ignore as an increasingly slippery slope for bulls.
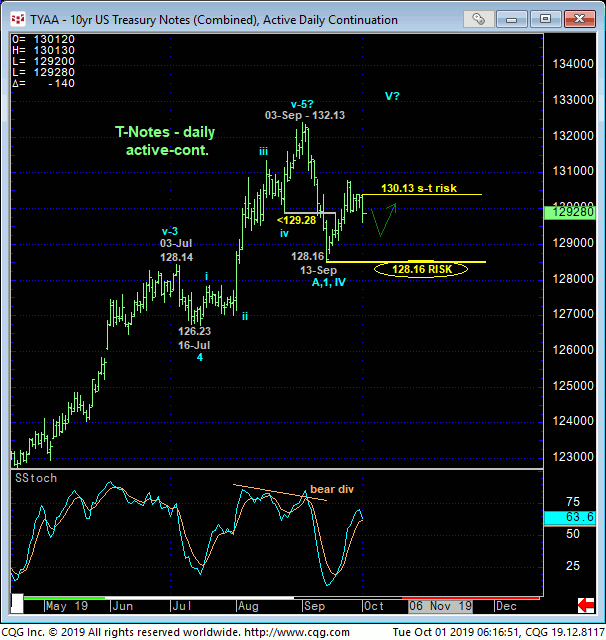
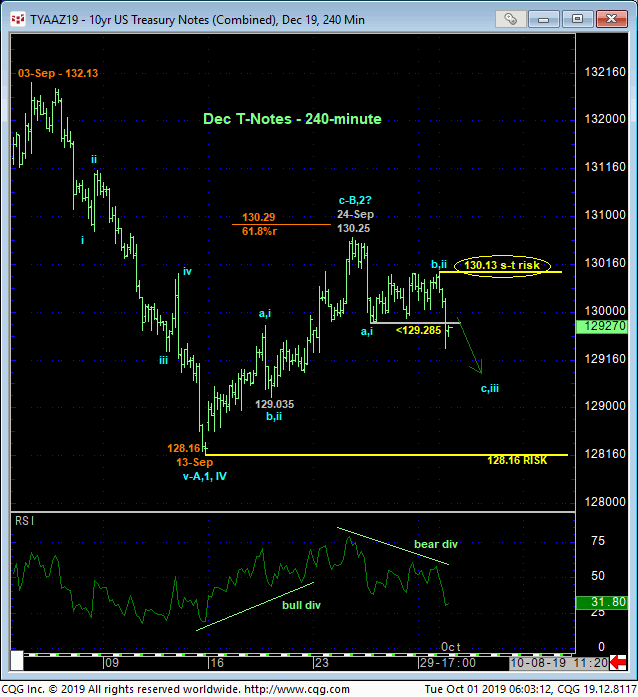
Drilling down to a shorter-term scale, overnight’s relapse below the 129.285 area that has supported the market the past few days confirms a bearish divergence in admittedly very short-term momentum. But this nondescript mo failure comes on the heels of 10-Sep’s bearish divergence in daily momentum (above) and a near 61.8%, 3-wave and thus corrective retrace of early-Sep’s 132.13 – 128.16 decline. And until the market recovers above at least today’s 130.13 high needed to render the past week’s relapse attempt a 3-wave and thus corrective affair, there’s no way to know that this resumed slide from 130.13 isn’t the 3rd-Wave of a more protracted correction or reversal lower. Per such this 130.13 levels is considered our new shot-term risk parameter from which non-bullish decisions like long-covers and cautious bearish punts can be objectively based and managed.
From a longer-term perspective however, commensurately larger-degree weakness below 13-Sep’s 128.16 low is required to render that low an initial (A- or 1st-Wave) low within a larger-degree correction or reversal lower. In this regard this 128.16 level is considered our long-term risk parameter from which long-term players can objectively rebase and manage the risk of a still-advised bulish policy.
In effect, we believe this market has identified 128.16 and 130.13 as the key directional triggers heading forward. Shorter-term traders are OK to move to a neutral-to-cautiously-bearish policy and exposure with a recovery above 130.13 required to negate this call, warrant its cover and resurrect a count calling for at least a more extensive corrective rebuttal to early-Sep’s swoon, if not a resumption of the secular bull. Long-term players remain advised to maintain a bullish policy and exposure with a failure below 128.16 required to threaten this call enough to warrant its cover.
MAR20 EURODOLLARS
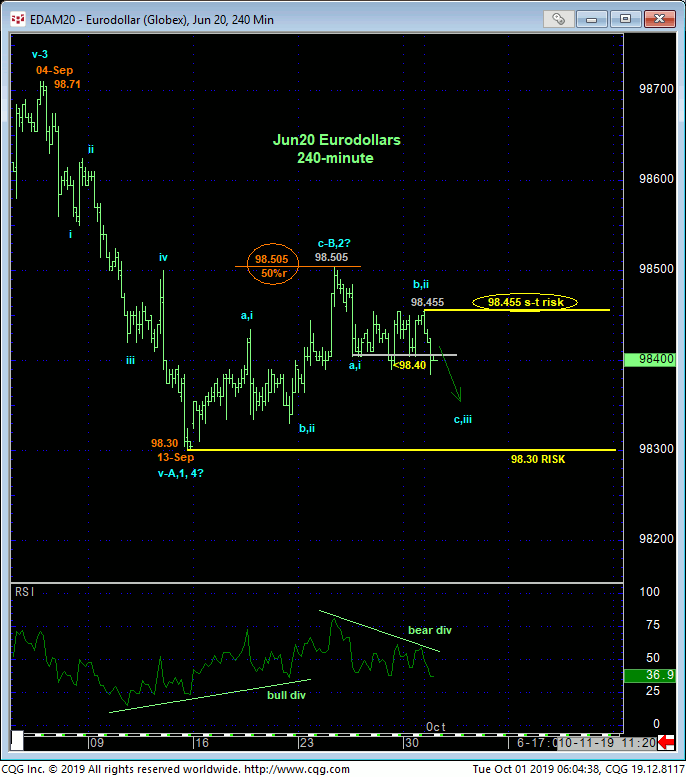
The technical construct and expectations for Eurodollars is virtually identical to that detailed above in 10-yrs with the key directional flexion points and short- and long-term risk parameters at 98.455 and 98.30, respectively, as detailed in the 240-min chart above and daily chart below. Overnight’s slip below 25-Sep’s 98.405 initial counter-trend low not only confirms the short-to-intermediate-term trend as down, it highlights 24-Sep’s 98.505 high that, thus far at least, is the end or upper boundary to what is only a 3-wave recovery from 13-Sep’s 98.30 low. Left unaltered by a recovery above at least 98.455 and certainly 98.505, mid-Sep’s 3-wave recovery attempt is easily considered a corrective/consolidative affair that warns of a resumption of early-Sep’s downtrend that preceded it. The Fibonacci fact that that 98.505 high is an exact 50% retrace of early-Sep’s 98.71 – 98.30 decline would seem to reinforce this corrective count and eventual resumption of early-Sep’s slide to new lows below 98.30.
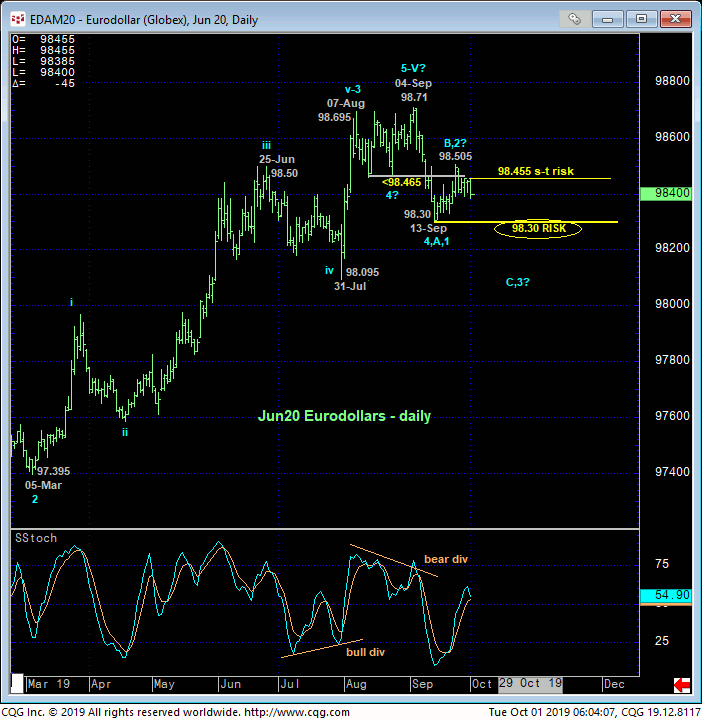
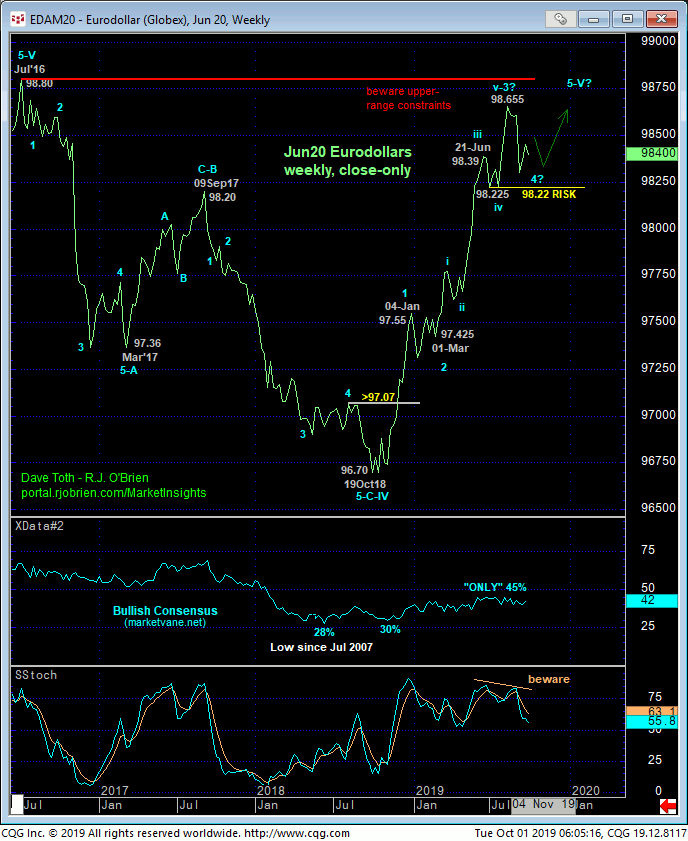
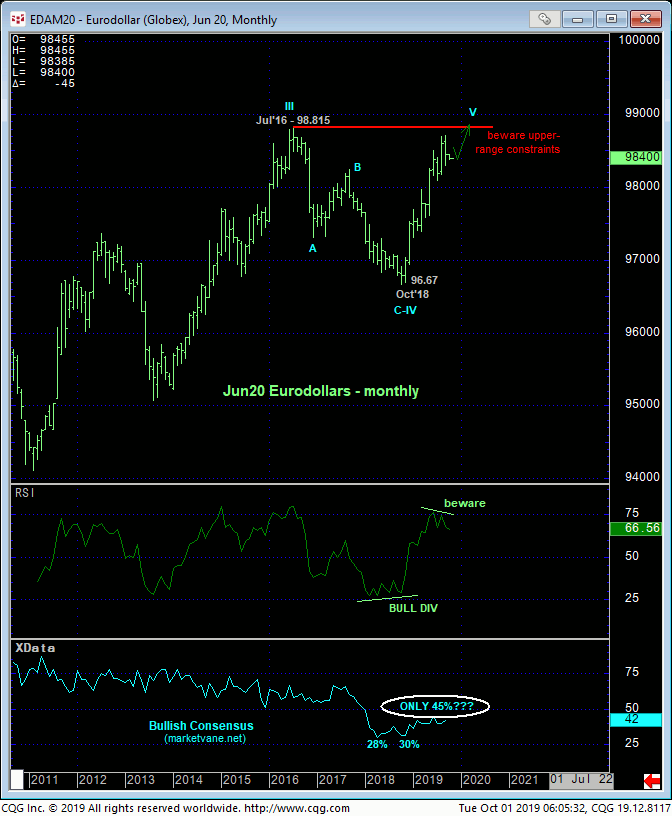
From a long-term perspective, the weekly close-only chart above and monthly chart below show how close to Jul’16’s 98.815 contract high the past year’s bull has come. If there’s a time and place to be increasingly leery of at least corrective setbacks, if not a broader peak/reversal process, it is here and now. The magnitude of the past year’s bull precludes us from concluding a major reversal lower if the market breaks 13-Sep’s 98.30 low and our key long-term risk parameter. Indeed, such a sub-98.30 break could still be a (C-Wave) component of a correction within the secular bull. BUT such a sub-98.30 will leave specific and objective corrective highs in its wake that the bull would then need to recoup to resurrect a bullish count. Until and unless it does, there’s no telling how much weakness and vulnerability exists below 98.30.
These issues considered, shorter-term traders are advised to move to a cautious bearish policy and exposure at-the-market (98.405) with a recovery above 98.455 required to negate this specific call and warrant its cover. Long-term players are OK to maintain a bullish policy and exposure with a failure below 98.30 required to defer or threaten this call enough to warrant its cover in order to circumvent the depths unknown of a larger-degree correction or reversal lower.
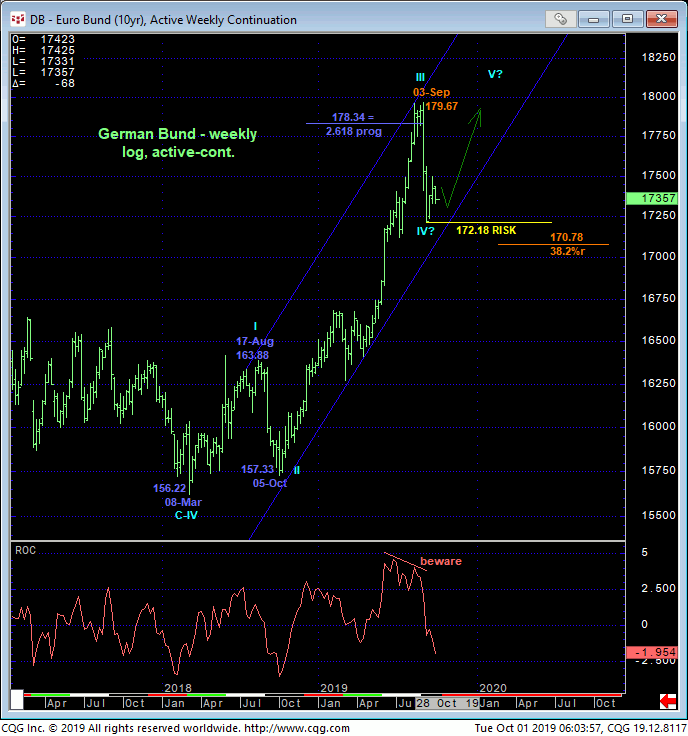
DEC BUNDS
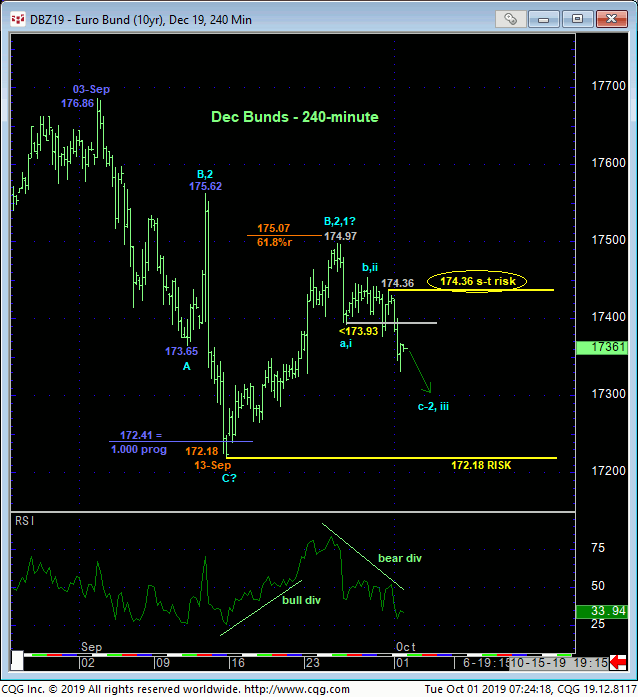
Here too, the past couple days’ relapse below last Wed’s 173.93 initial counter-trend low on a short-term 240-min basis above confirms a bearish divergence in short-term mo that stems mid-Sep’s recovery attempt at 174.97 and leaves yesterday’s 174.36 high in its wake as the latest smaller-degree corrective high the market would now be expected to sustain losses below per a more immediate, impulsive bearish count. Per such this 174.36 level serves as our new short-term risk parameter from which non-bullish decisions like long-covers and cautious bearish punts can be objectively based and managed by shorter-term traders with tighter risk profiles.
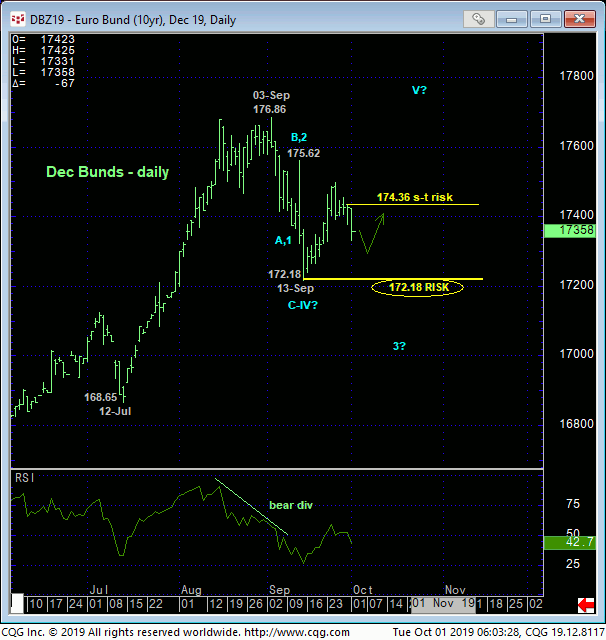
From a longer-term perspective the magnitude of the 18-MONTH bull from 08Mar18’s 156.22 low and 3-wave and thus corrective appearance of early-Sep’s sell-off attempt to 172.18 precludes us from concluding a broader peak/reversal environment at this time. But a relapse below that 172.18 low would certainly expose the new longer-term trend as down, the corrective or reversal depth of which would be indeterminable. Per such, long-term players are advised to consider that 172.18 low as our long-term risk parameter, the break of which would be sufficient to neutralize all previously recommended bullish policy and exposure to circumvent the depths unknown of a larger-degree correction or reversal lower.
These issues considered, a cautious bearish policy and exposure are advised for shorter-term traders from the 173.70-area OB with a recovery above 174.36 negating this specific call and warranting its cover. A bullish policy remains advised for long-term players with a failure below 172.18 threatening this call enough to warrant its immediate cover. In effect, we believe the market has identified 172.18 and 174.36 as the key directional triggers heading forward.
