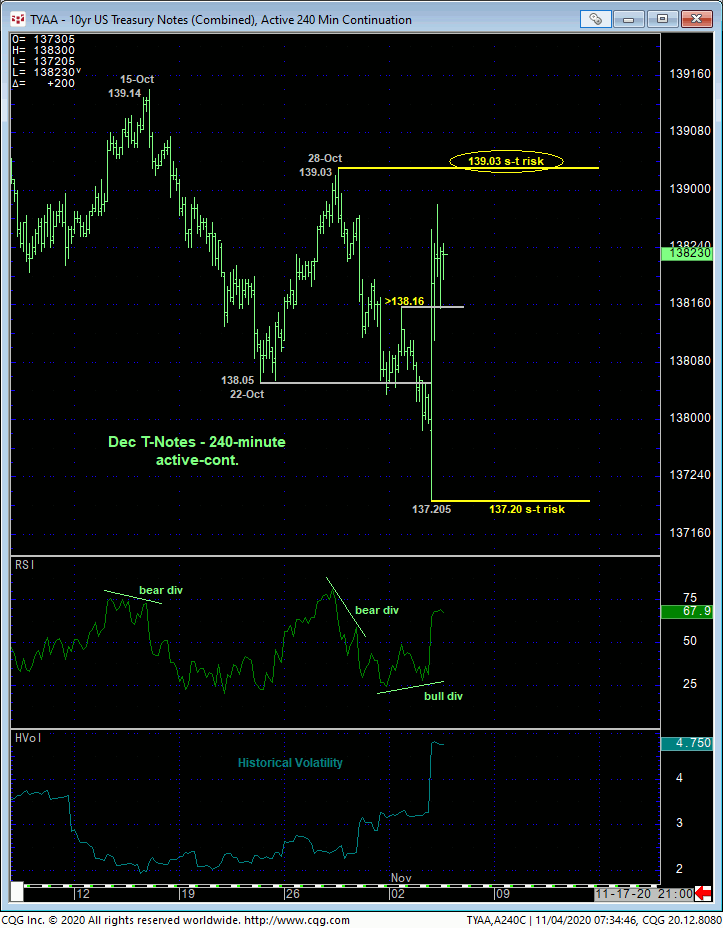
While equities, gold and interest rates were the biggest movers on Election day 2016, this year only U.S. Treasury rates have seen a sharp jump in volatility on a short-term basis, at least thus far. The 240-min chart of Dec T-Notes below shows this market plunging to a 137.205 low late yesterday afternoon- its lowest prices since early-Jun- before recovering sharply above a minor corrective high from Mon morning at 138.16 that confirms a bullish divergence in short-term momentum. While quite obvious now, this mo failure defines overnight’s 137.205 low as the end of the decline from 28-Oct’s 139.03 next larger-degree corrective high and clearly one of developing importance that can be used as a risk parameter from which non-bearish decisions like short-covers can now be objectively based and managed.
This said, 28-Oct’s 139.03 corrective high also remains intact as the high and risk parameter the market still needs to recoup to confirm a bullish divergence in daily momentum and threaten our broader peak/reversal count introduced in 11-Aug’s Technical Webcast. Admittedly, this is roughly a 1-1/2-pt range that separates our “short-term” directional risk parameters. But this is just the nature of the current beast. Scalping for 32nds in this environment where historical vol has risen sharply is ill-advised.
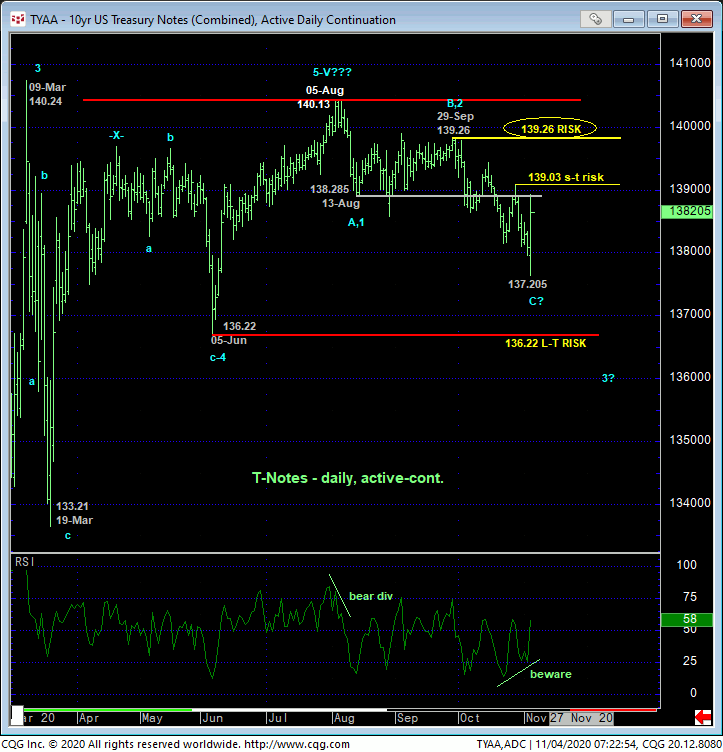
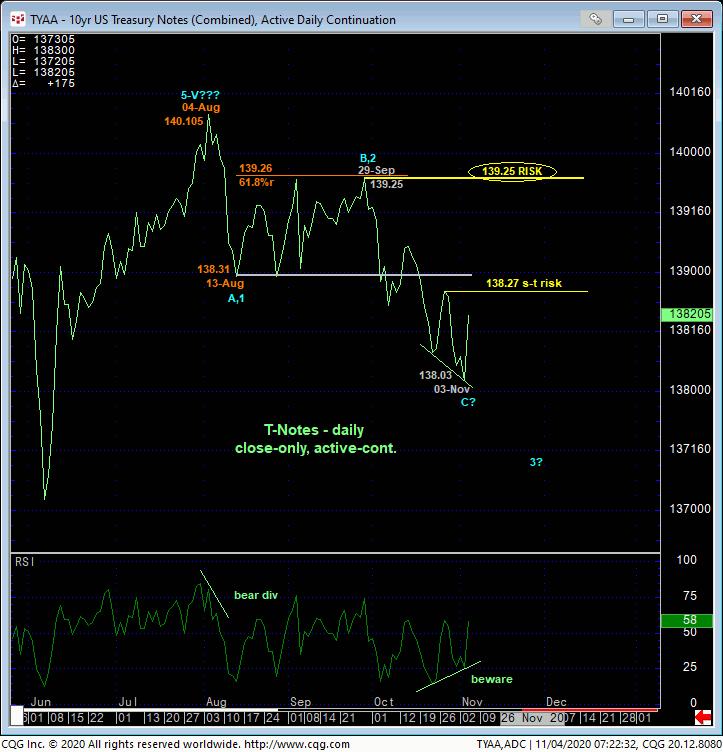
The daily bar chart above and close-only chart below show the nicely-developing POTENTIAL for a bullish divergence in momentum. However, PROOF of strength above last week’s 139.03 corrective high (or close above 138.27) is needed to CONFIRM this divergence to the point of non-bearish action on the next larger scale. And even then, the market will remain BELOW more than two months of former support-turned-resistance from the approximate 139.00-to-139-1/4-area.
To truly negate our long-term peak/reversal count, the market needs to recover enough to render the sell-off attempt from 04-Aug’s 140.105 high a 3-wave and thus corrective affair. This requires a recovery above 29-Sep’s 139.26 next larger-degree corrective high and key long-term bear risk parameter. Until and unless such commensurately larger-degree proof of strength is shown, longer-term institutional players remain advised to first approach recovery attempt to the lower-139-handle-area as corrective selling opportunities.
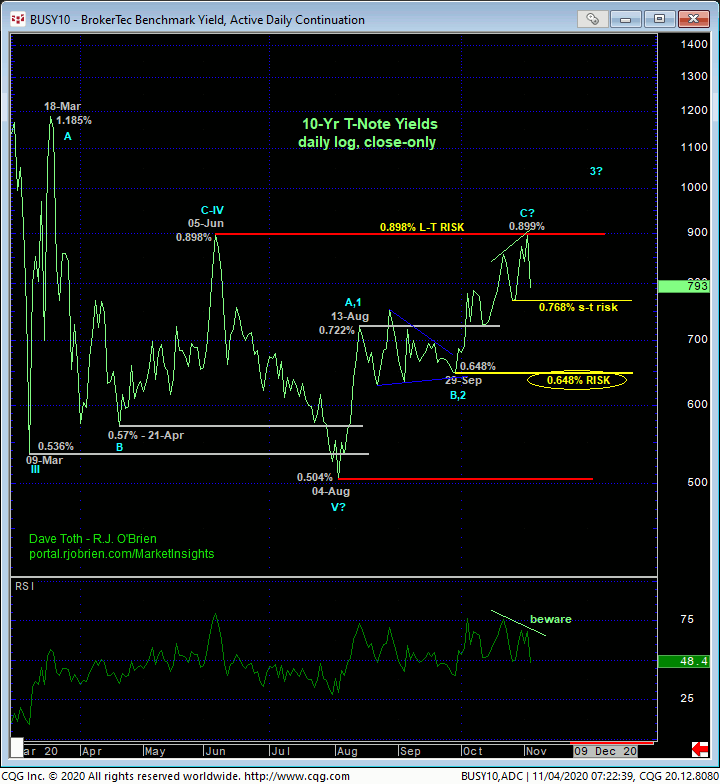
The daily log close-only chart of 10-yr yield above shows the inverted potential for a bearish divergence in daily mo that will be confirmed on a failure below 27-Oct’s 0.768% corrective low. The fact that this divergence potential stems from the immediate area surrounding 05-Jun’s 0.898% key high is interesting and acknowledges this early-Jun level as a key longer-term flexion point.
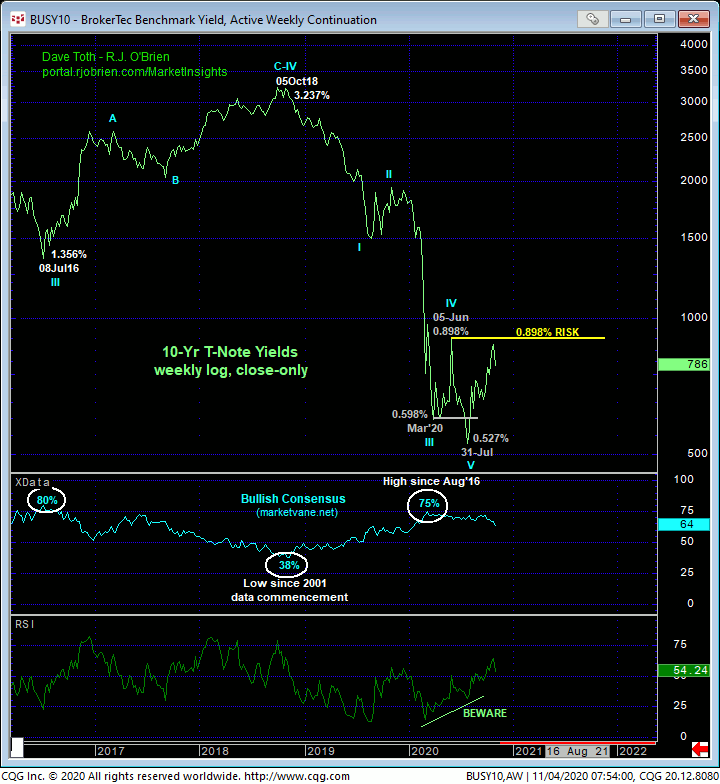
We have identified this 0.898% level as THE KEY threshold this market needs to recoup to, in fact, break at least the TWO-YEAR downtrend in rates from Oct’18’s 3.237% high shown in the weekly log close-only chart below. To see “some” corrective setback from this pivotal 0.898%-area is not surprising. But commensurately larger-degree weakness in rates below 29-Sep’s 0.648% larger-degree corrective low is required to render Aug-Nov’s recovery attempt a 3-wave and thus corrective structure that would then re-expose the secular downtrend in rates.
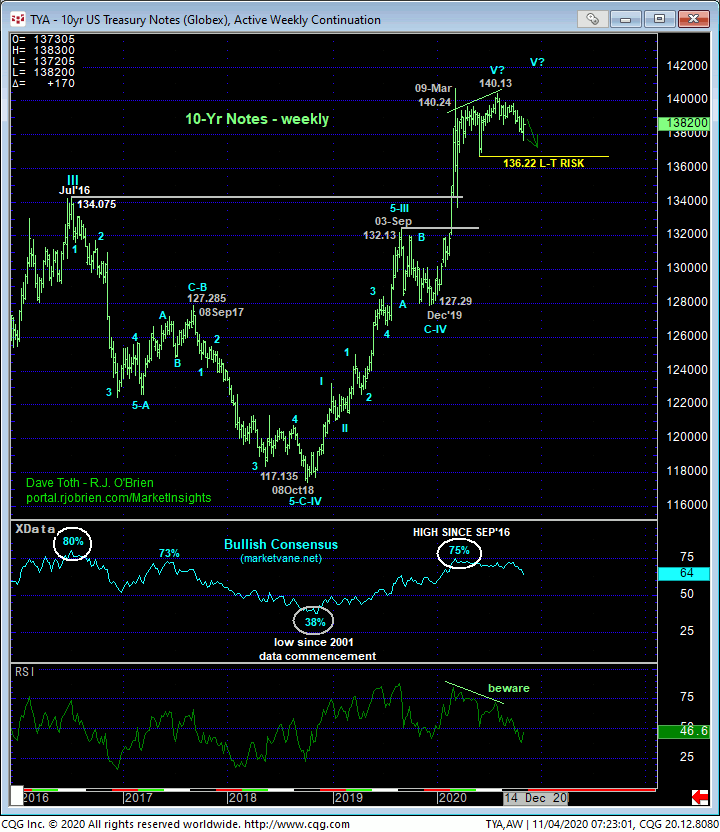
From a very long-term perspective, our major peak/reversal count remains predicated on:
- upside momentum that’s been waning for EIGHT MONTHS
- historically frothy sentiment/contrary opinion conditions that haven’t been seen since those that warned of and accompanied Jul’16’s major peak/reversal and
- an arguably complete 5-wave Elliott sequence up from Oct’18’s 117.13 low.
This is a unique and compelling list of elements that is typical of major peak/reversal-threat environments. And with respect to the prolonged nature of this peak/reversal process in terms of TIME, it is virtually identical to the NINE MONTHS it took for this market to finally reverse 2016-2018’s major downtrend.
In sum, a bearish policy remains advised for long-term players with a recovery above 139.26 required to negate this call and warrant its cover. Shorter-term traders can have their volatile pick: maintain a bearish posture with a recovery above 139.03 required to negate this call and warrant its cover OR neutralize bearish exposure and require a relapse below 137.20 to negate this call, reinstate the bear and warrant a return to a bearish policy. We will be watchful for anther bearish divergence in short-term momentum from a level south of 139.03 needed to arrest today’s spasm and reject/define a more reliable high from which shorter-term traders can objectively rebase bearish directional biases and exposure.