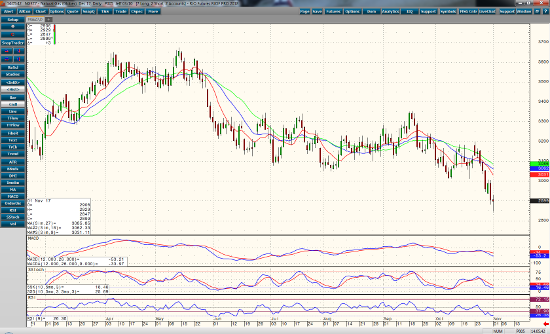
The recent short term down trend seems to be coming to an end. We are still waiting on confirmation from all momentum indicators. MACD, RSI, and Stochastics are all at oversold levels. We are waiting for a divergence to confirm the change of trends to the positive. $2.850 is close in support, and $3.000 is still a key level for reversal. A close above the $3.000 level could signal a push to $3.100-3.2000 as resistance. Today’s candle demonstrates the traders’ uncertainty on which way to go, and many times this signals a change in bias. The lower high and lower low signal for caution, but this set up means a change more often than not.
Storage for the week is set to come in at 63bcf, which is more than the 5 year average at 60 bcf. Selling pressure came from the above average mild temperatures in the past few weeks. The total storage is slightly behind the 5 year average, and this infusion doesn’t look like enough to make much of a difference there. A shift in the jet stream and a blast of arctic air may be all that is needed to turn the tides on the natural gas market.
Dec ’17 Natural Gas Daily Chart


