FEB CRUDE OIL
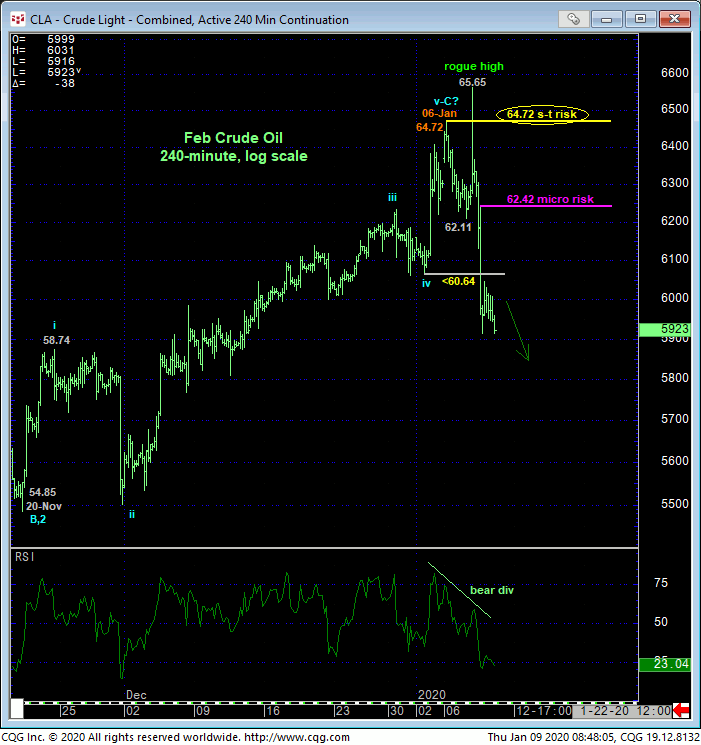
For the better part of the past month as the market has encroached on the upper recesses of 2019’s lateral range and middle-half of the past couple years’ range, we’ve been reluctant to fully embrace the not-unimpressive uptrend from 03-Oct’s 50.99 low. Waning upside momentum and the return to historically frothy levels in our RJO Bullish Sentiment Index of the hot Managed Money positions reportable to the CFTC contributed to a slippery slope against the backdrop of a merely lateral range. The extent and impulsiveness of yesterday’s collapse below 02-Jan’s 60.64 low and our short-term but key risk parameter finally confirms the bearish divergence in momentum that threatens Oct-Jan’s uptrend enough to move to a neutral-to-cautiously-bearish stance as this mo failure defines (we think) 06-Jan’s 64.72 high as the end of the uptrend from at least 20-Nov’s 54.85 low and possibly from 03-Oct’s 50.99 low.
While commensurately larger-degree weakness below at least former 57.88-area resistance-turned-support from early-Nov remains arguably required to break the 3-month uptrend, within the context of the past year’s lateral range we believe this level to lack relevance and practicality. Per such, we’re defining Mon’s 64.72 high as the orthodox top to the rally from at least 54.85 (and possibly from 50.99) and shorter-term but key risk parameter from which to objectively move to a cautious bearish policy ahead of a more protracted correction or reversal lower.
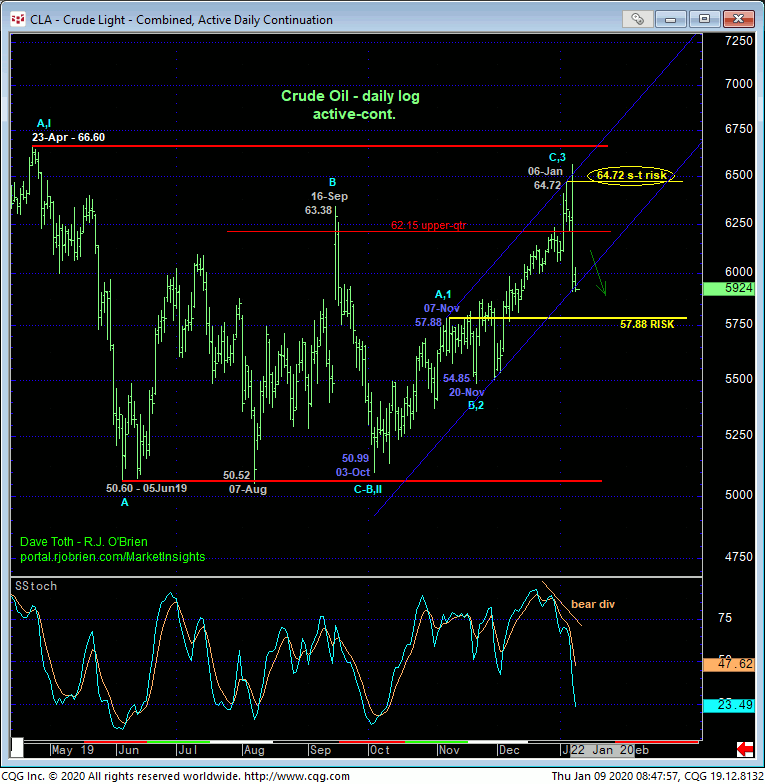
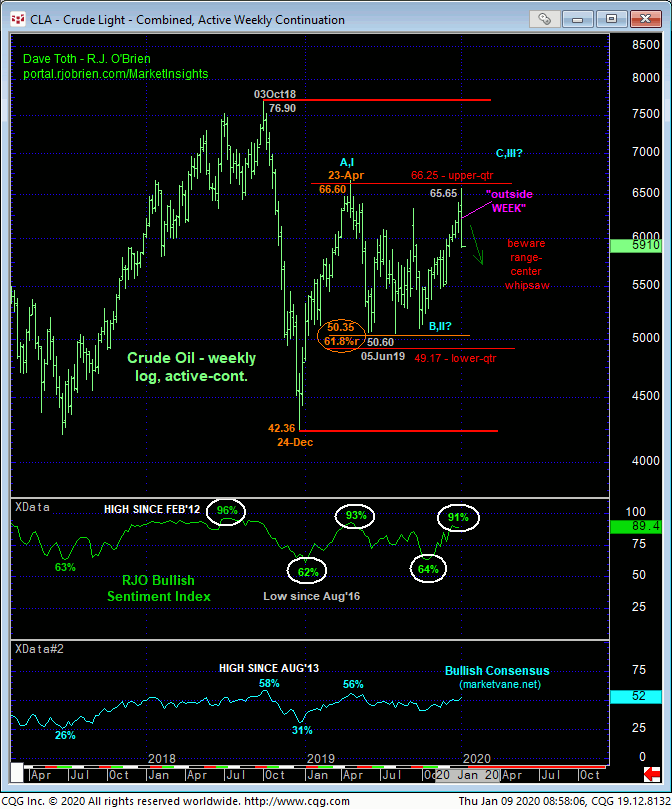
The weekly log chart above shows this week’s obvious, “outside WEEK” rejection of the extreme upper recesses of the past year’s lateral range amidst historically high levels in our RJO BSI that have warned of and accompanied major peak/correction/reversal conditions in the past. Now that the market has, in fact, stemmed the past few months’ uptrend with a mo failure below 60.64, we have a specific and reliable market-defined high, resistance and parameter at 64.72 from which we can objectively base and manage non-bullish decisions like long-covers and new bearish punts.
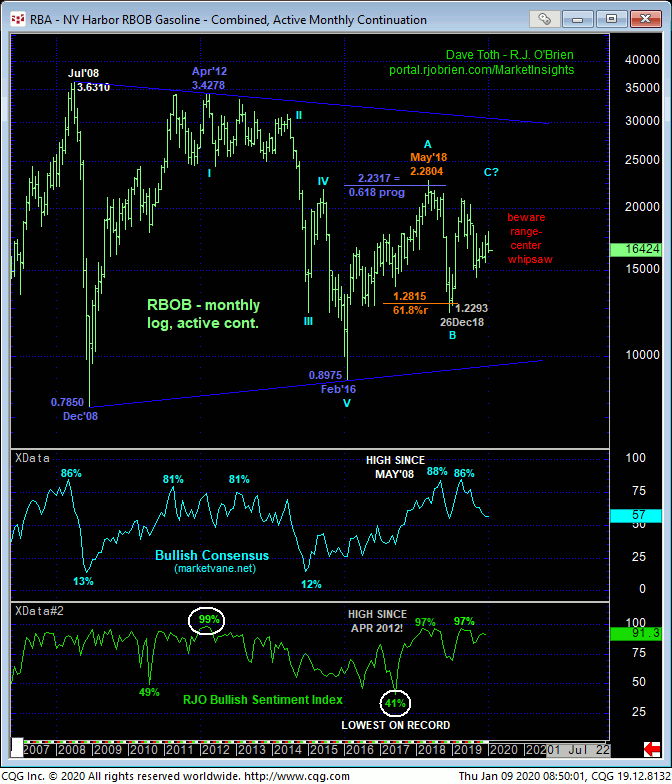
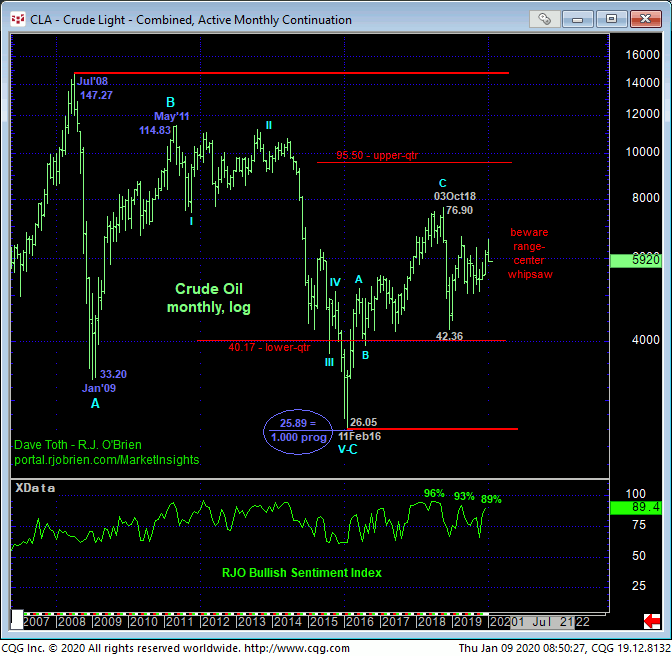
Given the market’s position still deep, deep within the middle-half bowels of its historical lateral range shown in both the weekly (above) and monthly (below) log scale charts, further aimless, choppy, lateral, whipsaw behavior should hardly come as a surprise. The only difference now from just a few days ago is that we believe such price action will now come within a lateral-to-LOWER channel fr what could be quite a while.
These issues considered, all previously advised bullish policy and exposure have been nullified with traders moving to a neutral/sideline position. Given the market’s quick return to near the middle of the past year’s lateral range, we do NOT suggest chasing bearish exposure lower. Rather, we advise waiting for and requiring proof of a 3-wave corrective rebuttal to this week’s relapse- perhaps to the 62.00-area OB- AND another bearish divergence in short-term mo to stem that rebuttal to considered a preferred risk/reward selling opportunity. In the meantime, a neutral/sideline position is advised.
FEB HEATING OIL
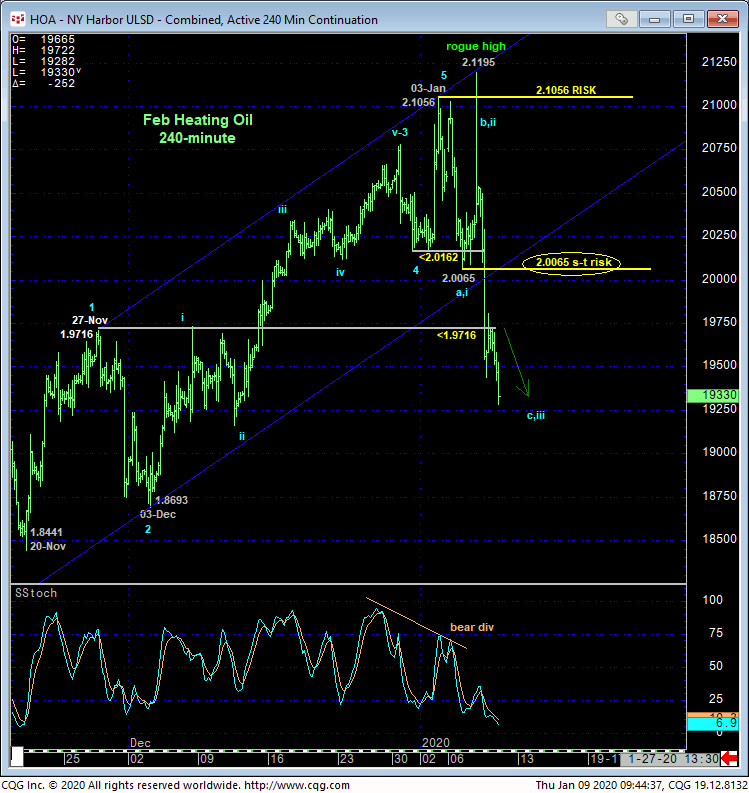
The technical construct and expectations for the heating oil market are generally the same as those detailed for crude oil above, the only difference being diesel’s clear break yesterday below a ton of former 1.97-handle-area resistance that should’ve held as support per any broader bullish count. The extent of this week’s meltdown defines 03-Jan’s 2.1056 high as the END of at least a 5-wave Elliott sequence up from 20-Nov’s 1.8441 low and possibly the end of a huge 3-wave recovery attempt that dates from 07Aug19’s 1.7450 low. Per such, that 2.1056 high serves as our new long-term risk parameter the market needs to recoup to mitigate any peak/correction/reversal counts and resurrect a much broader bullish count. Until such strength is shown, we believe a return to the (1.8115 or lower) lower-quarter of the past couple years’ range, or worse, lies ahead.
Tue’s 2.0065 initial (prospective 1st-Wave) counter-trend low serves as our new short-term risk parameter the market is now minimally required to recoup to jeopardize the impulsive integrity of a more immediate bearish count.
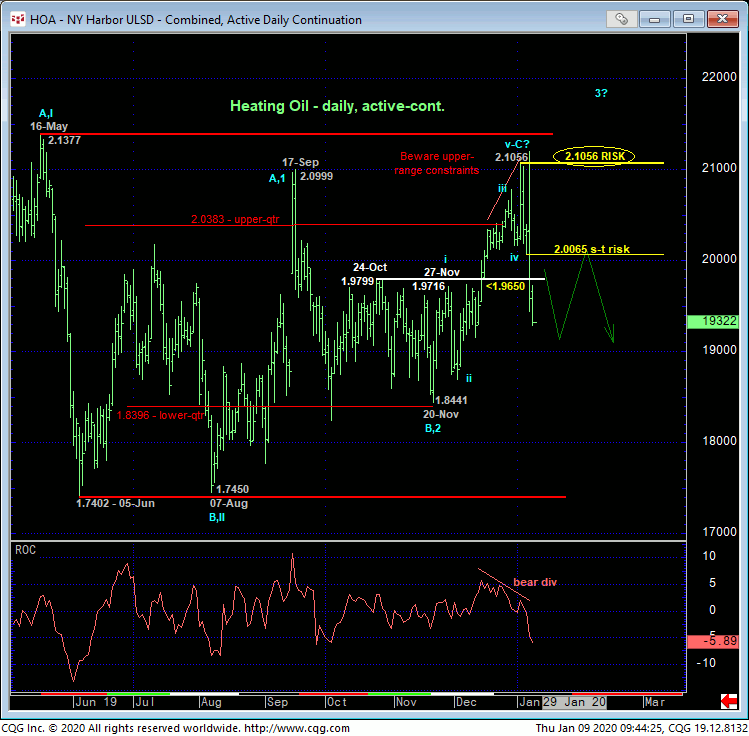
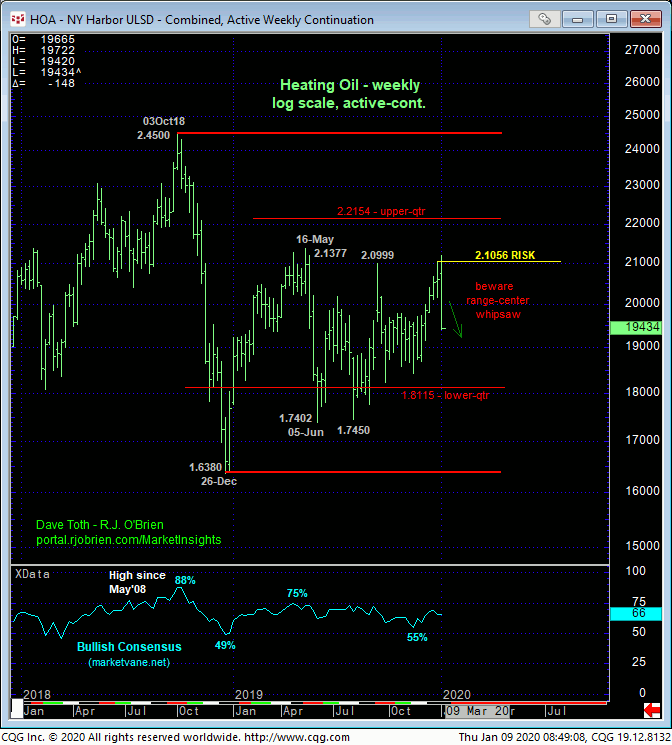
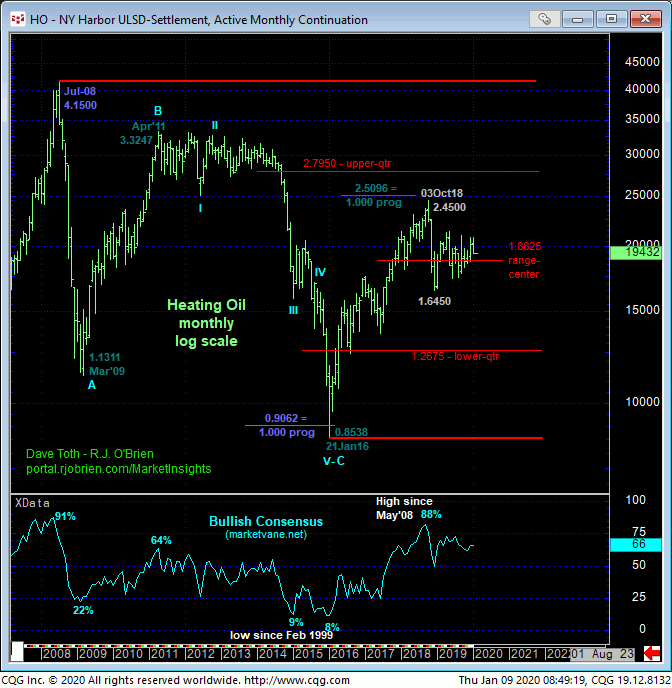
Here too, from a much longer-term perspective, the weekly (above) and monthly (below) log scale charts show this market to be deep within the middle-half bowels of its historical lateral range. We’ve discussed the greater odds of aimless whipsaw risk for months. And this week’s reversion to this range-center may warrant this same discussion for months to come.
In sum and while the market has mitigated any broader bullish count with this week’s failures (first below 2.0162 and subsequently below 2.0065), the market’s current position in the middle of the past year’s range presents poor risk/reward merits from which to initiate directional exposure, so a neutral/sideline policy is advised. We advised waiting for another intra-range corrective rebound- perhaps to the 2.03-handle- and a bearish divergence in shorter-term momentum to arrest that rebound to consider a preferred and more favorable risk/reward selling opportunity. In the meantime, further lateral-to-lower prices should not surprise.
FEB RBOB
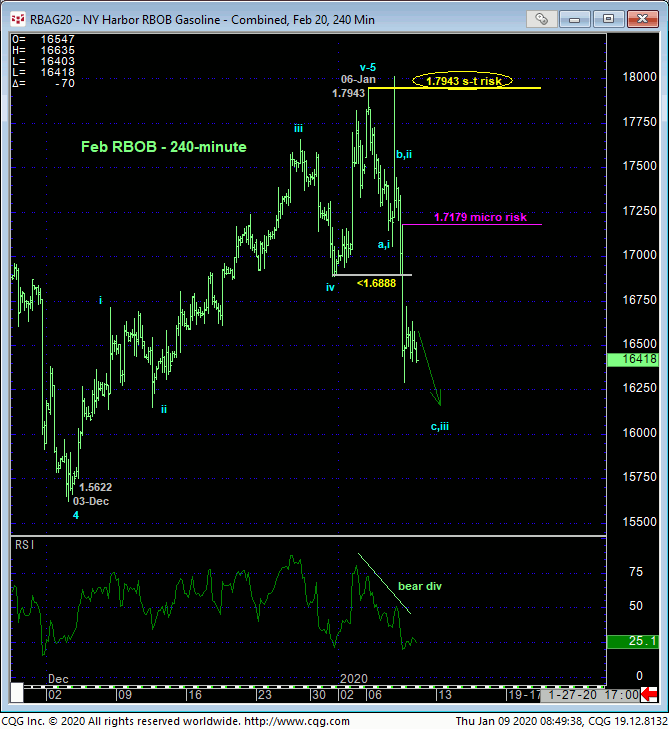
The technical construct and expectations for gas are identical to those detailed above for crude oil, with the extent and impulsiveness of this week’s momentum failure below 31-Dec’s 16888 low and short-term risk parameter defining 06-Jan’s 1.7943 high as one of developing importance and possibly the end of the rally from 03-Sep’s 1.4148 low. Per such, this 1.7943 high serves as our new short-term but key risk parameter from which traders can objectively base non-bullish decisions like long-covers and new bearish punts. This said, traders are urged to wait for a corrective rebuttal that could be relatively extensive in the weeks ahead and to A 1.73-handle for a preferred risk/reward selling opportunity. A minor corrective high from yesterday ,morning at 1.7179 serves as a micro risk parameter the market is minimally required to recoup at this point to suggest this week’s swoon is over and that the market is correcting higher. In lieu of such strength, further lateral-to-lower prices are expected.
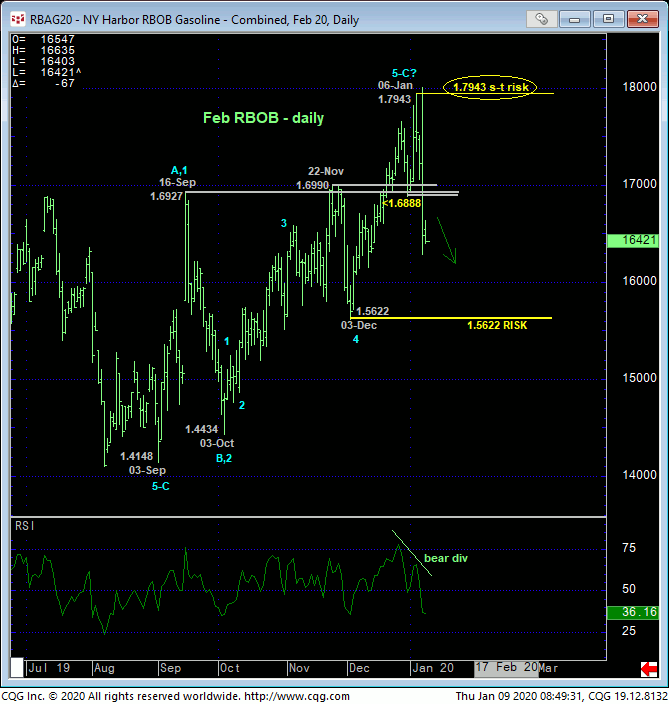
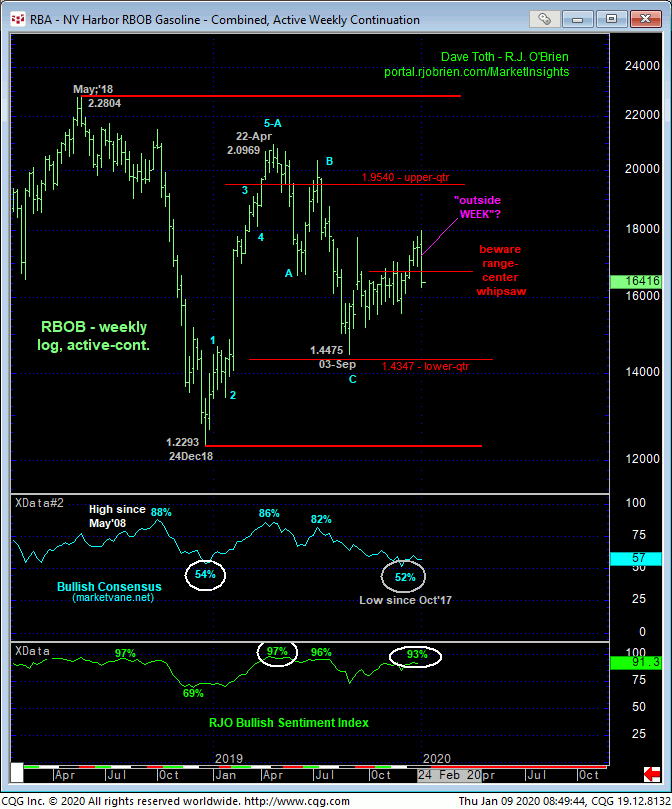
Here too, only a glance at the long-term charts is needed to see that this market is deep in the middle of its long-term lateral range that’s a coin flip. Combined with this week’s confirmed bearish divergence in daily momentum however, historically frothy levels in our RJO BSI would seem to reinforce a broader peak/correction/reversal count to levels indeterminately lower within the long-term range. Chasing bearish exposure lower is not advised however. Rather, we recommend waiting for what could be a more extensive (B- or 2nd-Wave) corrective rebound to the 1.73-handle OB for a preferred risk/reward selling opportunity.
