AUG CRUDE OIL
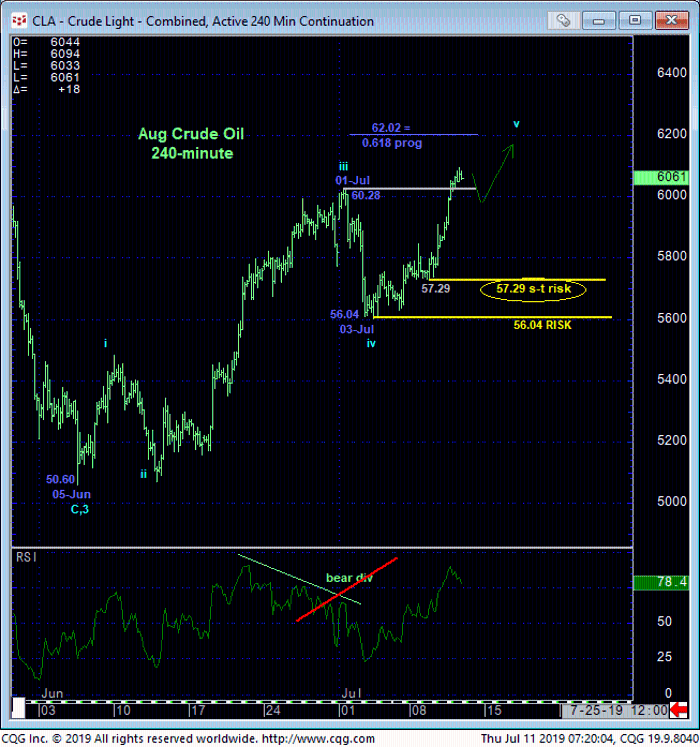
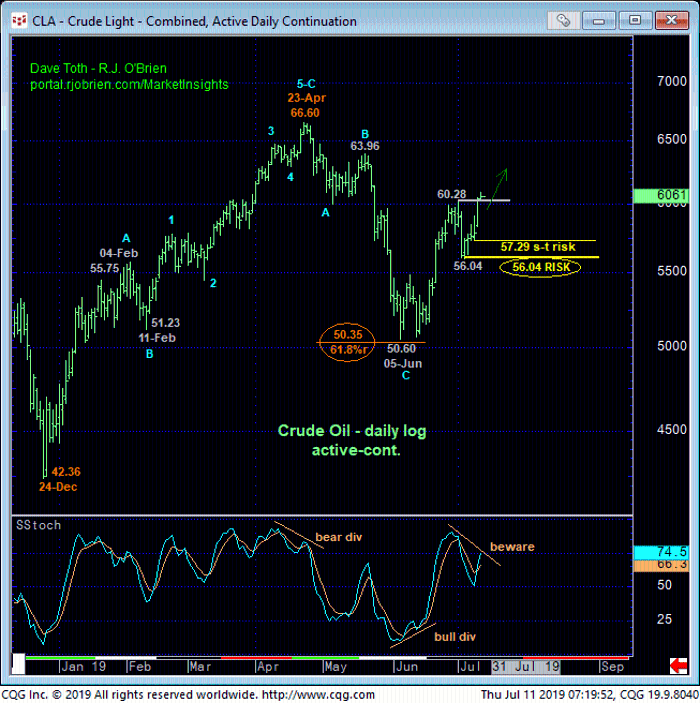
Yesterday and overnight’s recovery above 01-Jul’s 60.28 high and our short-term risk parameter nullifies 02-Jul’s bearish divergence in short-term momentum and reinstates this summer rally from 05-Jun’s 50.60 low. This resumed strength leaves smaller- and larger-degree corrective lows in its wake at 57.29 and 56.04, respectively, that the market must now sustain gains above to maintain a more immediate bullish count. Its failure to do so will confirm another bearish divergence in momentum, threaten this uptrend and expose another larger-degree correction within the mammoth lateral range that constrains it. In this regard these levels represent our new short- and longer-term risk parameters from which a bullish policy can either be rebased and managed by longer-term players or resumed by shorter-term traders.
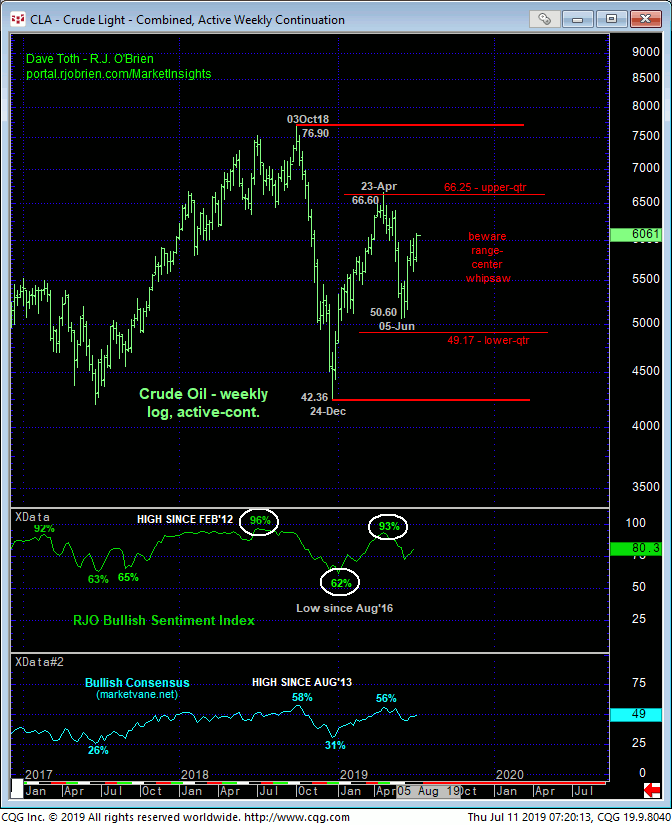
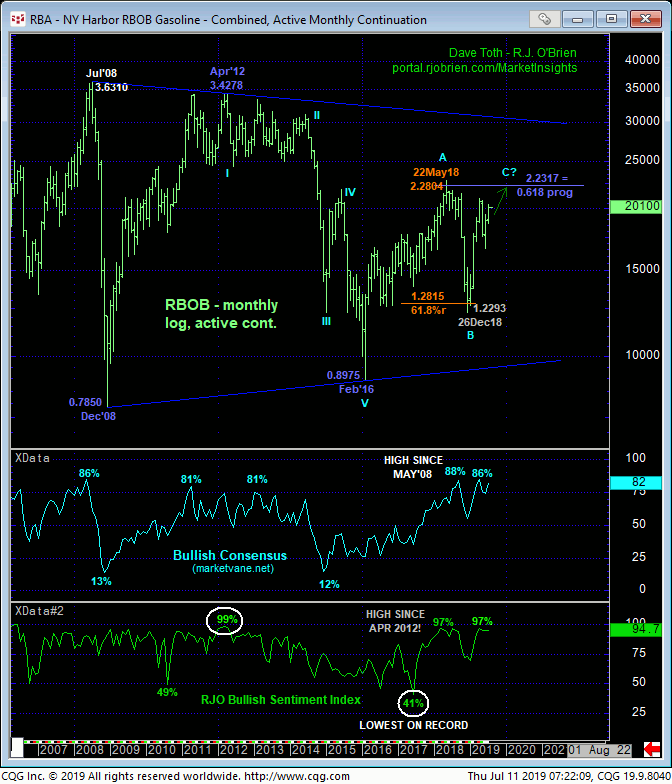
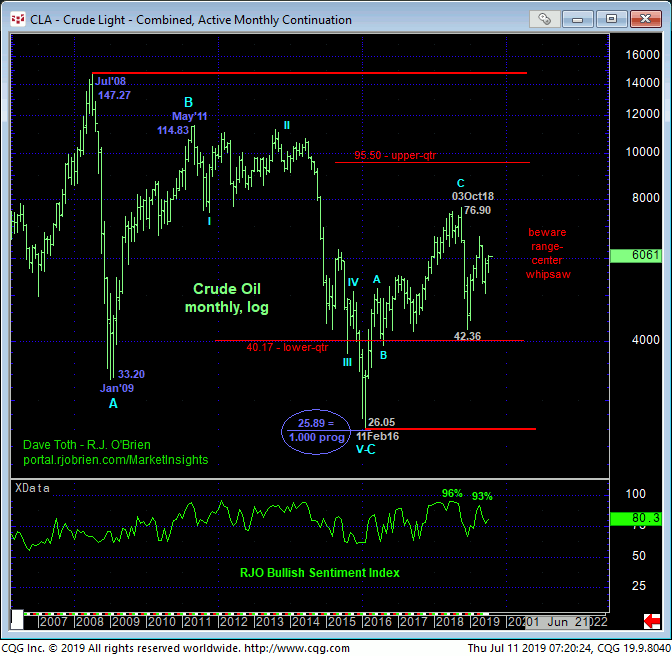
These risk parameters will come in handy given the market’s position still deep within the middle-half bowels of not only the past year’s range shown in the weekly log chart above, but also the massive 11-YEAR range shown in the monthly log chart below. Such range-center conditions are characterized by greater odds of aimless whipsaw risk that, on this scale, warrant a more conservative approach to risk assumption.
If a bullish position is warranted because of yesterday’s break above a relatively nondescript intra-range level like 01-Jul’s 60.28 high, then we should require the bull to behave like one and prove continued trendy, impulsive price action higher. Slippage back below corrective lows like 57.29 and 56.04 would NOT be consistent with such a more immediate bullish count and would warrant defensive steps. Until and unless such weakness is shown however, the intermediate-to-longer-term trend remains arguably up and we act on the premise that we don’t know how high “high” is.
These issues considered, a bullish policy and exposure are advised with a failure below 57.29 required to threaten this call enough to warrant its cover. In lieu of such sub-57.29 weakness further and possibly accelerated gains are expected.
AUG HEATING OIL
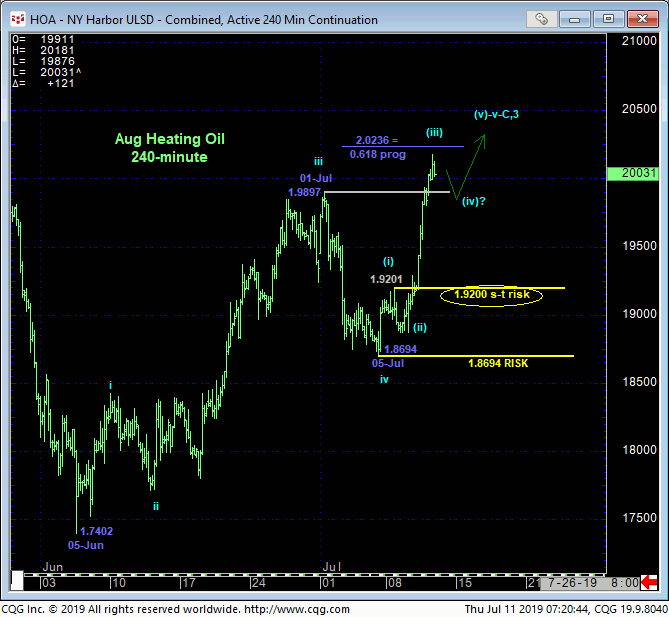
The technical construct and expectations for the diesel market are virtually identical to those detailed above in crude with 1.9200 and 1.8694 representing our new short- and longer-term risk parameters from which a bullish policy and exposure can be objectively rebased and managed.
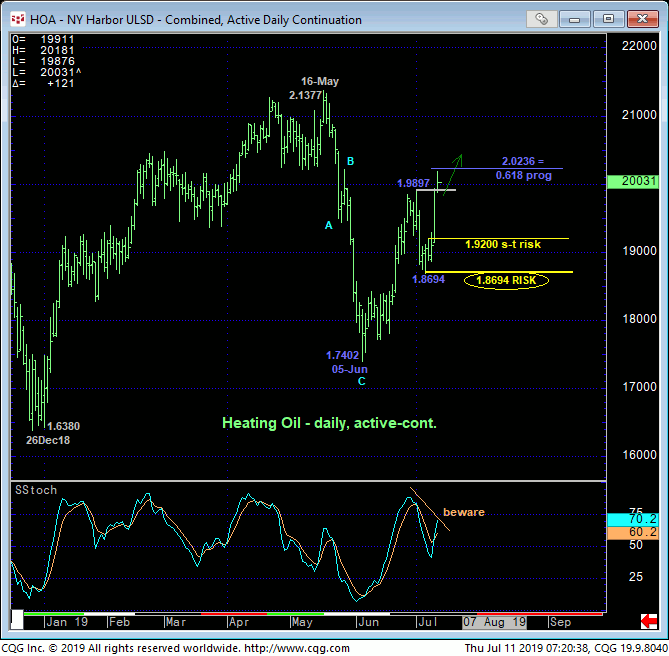
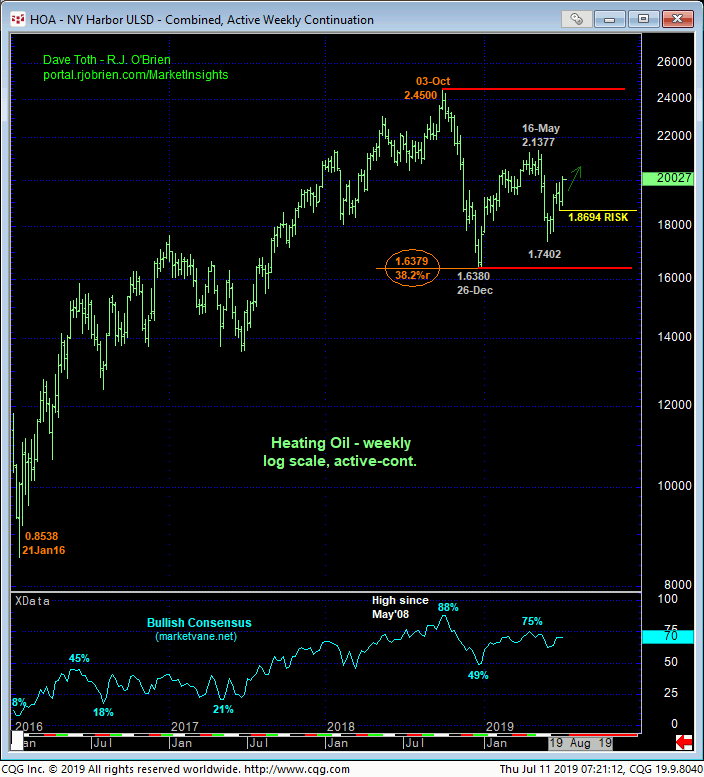
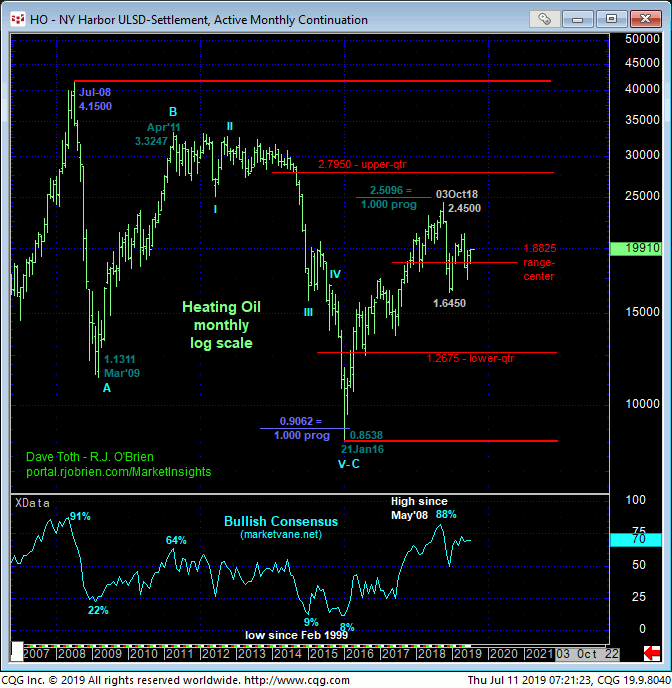
Here too, from a longer-term perspective shown in the weekly log chart above and monthly log chart below the market remains stuck in a “ranges-within-ranges” condition where the odds of aimless whipsaw risk are advised to be approached as higher, warranting a more conservative approach to risk assumption that places an emphasis on tighter but objective risk parameters like 1.9200 and 1.8694. In lieu of such weakness the intermediate-to-longer-term trend is up and should not surprise by its continuance or acceleration.
AUG RBOB
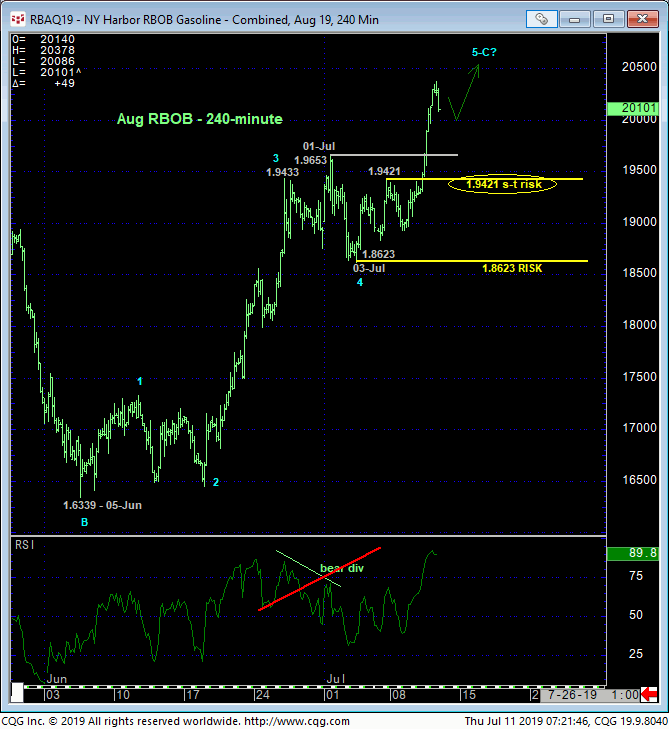
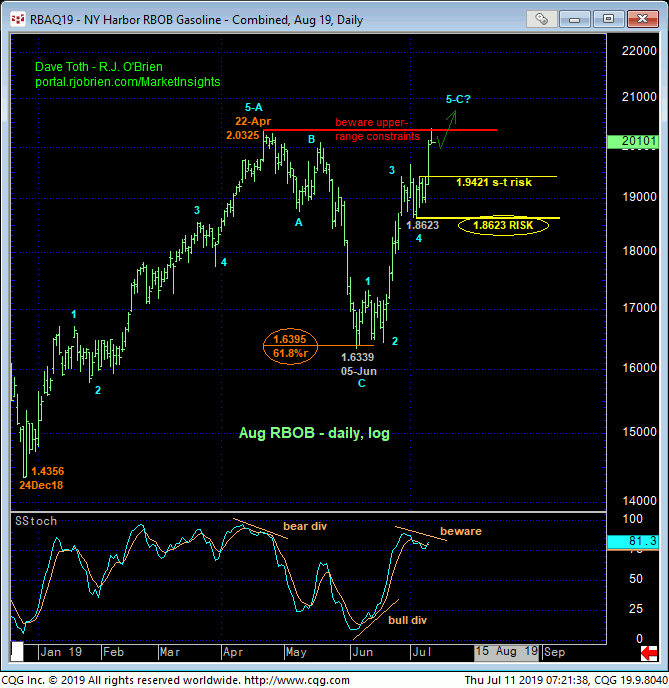
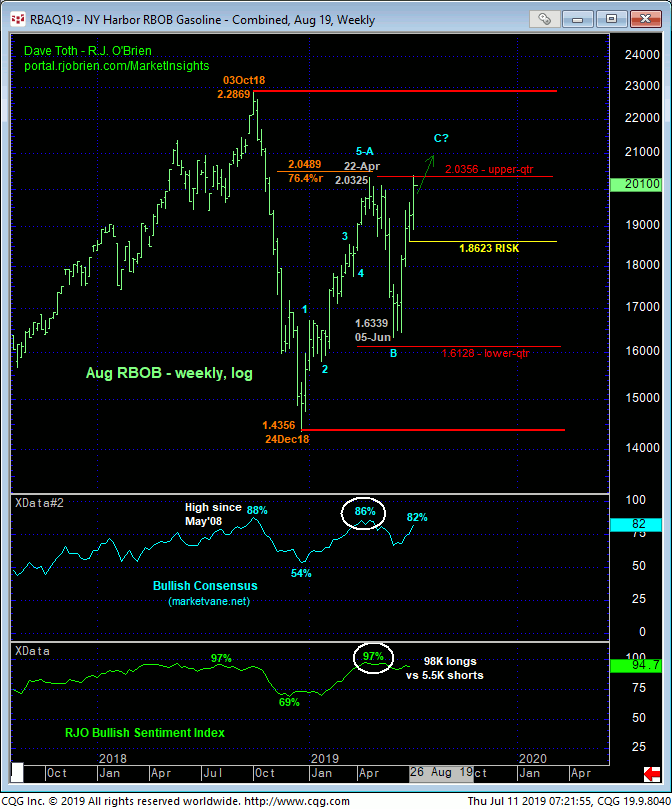
The technical construct and expectations for RBOB are the same as those in diesel with our short- and longer-term risk parameters at 1.9421 and 1.8623. These risk parameters will come in handy given the market’s proximity to 22-Apr’s 2.0325 high and the encroachment on the upper-quarter of the past year’s range shown in the weekly log chart below. In sum, a cautious bullish policy remains advised with a failure below 1.9421 required to threaten this call enough to warrant paring or covering bullish exposure commensurate with one’s personal risk profile.
