In recent crude oil, heating oil and RBOB updates, we’ve questioned whether these market’s have retraced enough to break the uptrends from even their early-Dec lows, maintaining the still-bullish prospect that the past week’s setbacks were just slightly larger-degree corrections. As a result of today’s continued, even accelerated slips, it remains premature to conclude that the secular bull markets across the energy complex board have ended. But for reasons detailed below, we believe the risk/reward metrics of maintaining a longer-term bullish outlook have eroded enough to warrant flipping the script to broader peak/reversal counts rather than peak/corrective counts that warrant first approaching what we still believe will be rebuttals to this month’s swoons as corrective SELLING opportunities. And from early indications just this morning, such a flip could impact other commodity sectors like the ags, softs and metals.
APR HEATING OIL
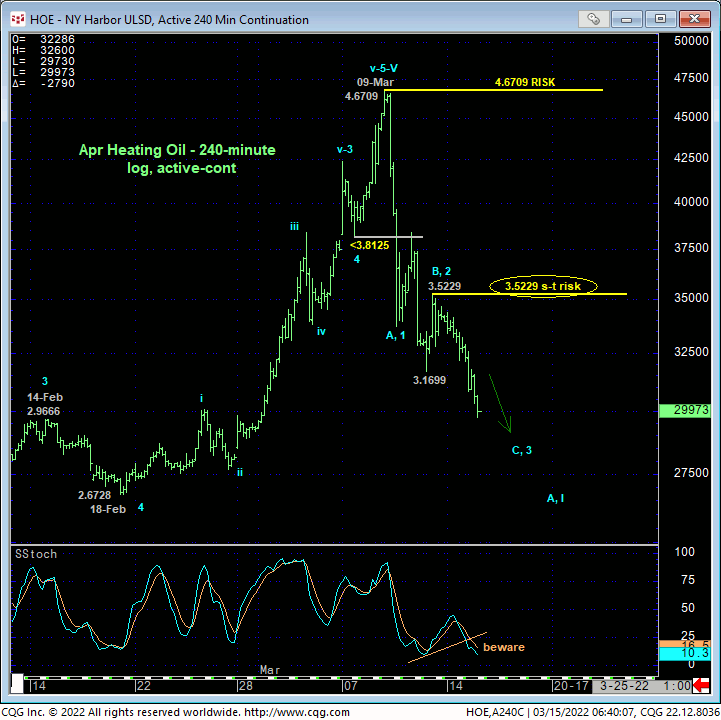
On a shorter-term basis, today’s clear break below Fri’s 3.1699 low reaffirms the developing downtrend and leaves Fri’s 3.5229 high in its wake as the latest smaller-degree corrective high this market is now minimally required to recoup to confirm a bullish divergence in short-term momentum, stem the slide and expose an interim corrective rebound or possibly a resumption of the secular bull trend. Per such, this 3.5229 level serves as our new short-term risk parameter from which long-covers and cautious bearish punts can now be objectively based and managed.
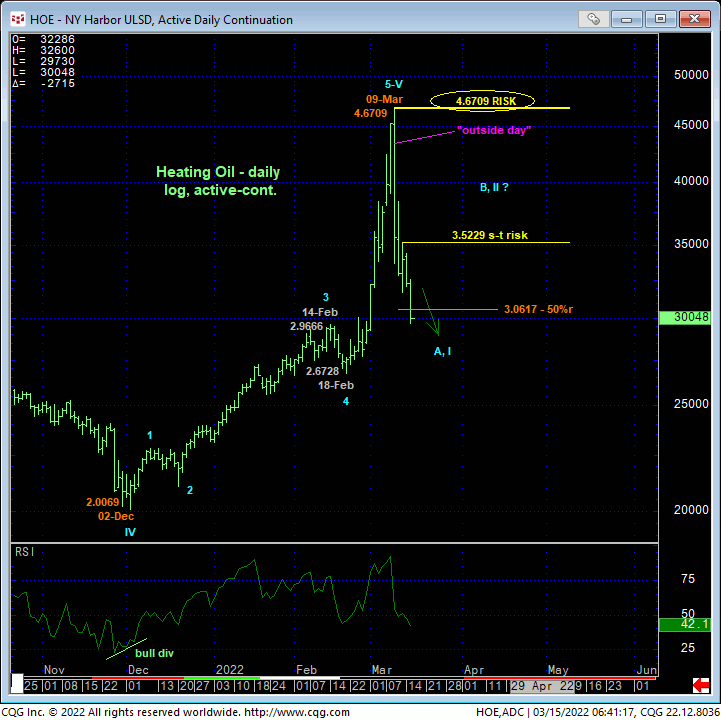
From a longer-term perspective is where the broader correction-vs-reversal debate may be taking a turn to the latter. As recently discussed and relative to the magnitude of the massive secular bull trend, we’ve allowed the directional jury to be out as to whether 09-Mar’s 4.6709 high completed just 3-waves up from 02-Dec’s 2.0069 low or five. While this debate arguably remains and while the market has yet to break a former consolidation battleground around 2.96-to-2.67 from mid-Feb, it is our opinion that the past week’s decline has just spanned too wide a ride to still be prioritized as a correction. It has retraced more than 50% of the entire Dec-Mar portion of the bull from 2.0069 to 4.6709 on a log scale that we believe is either the initial 1st-Wave of a major peak/reversal process or just the initial A-Wave of a major correction that could span months or even quarters.
This said and as is typical of most peak/reversal processes, we would still anticipate a B- or 2nd-Wave corrective rebuttal to his initial decline that could be extensive in terms of both price and time. Herein lies the importance of identifying a shorter-term risk parameter like 3.5229, the recovery above which would expose at least such a corrective rebound and possibly re-expose the secular bull.
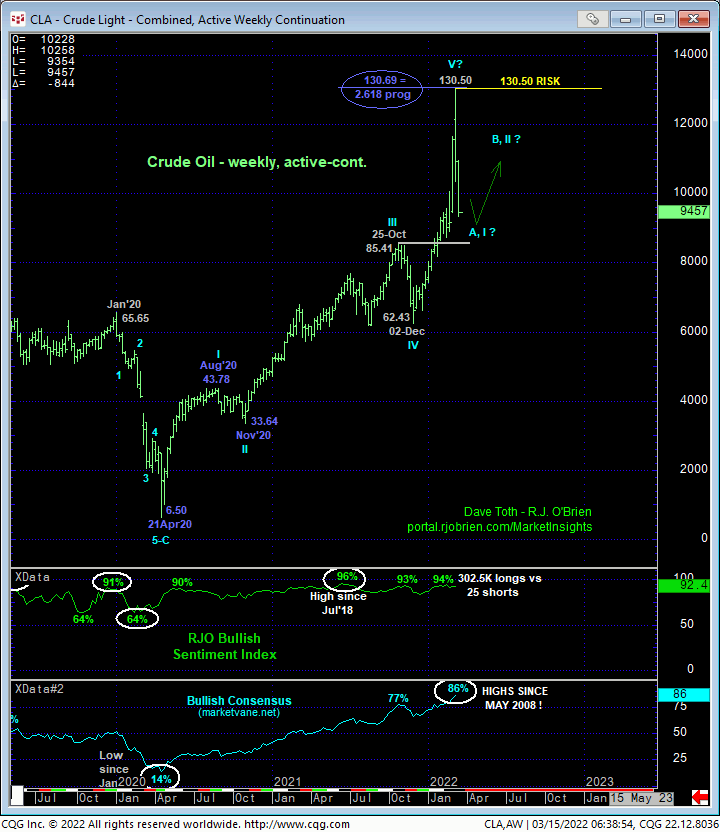
Contributing to a broader peak/reversal count are some longer-term elements typical of such environments:
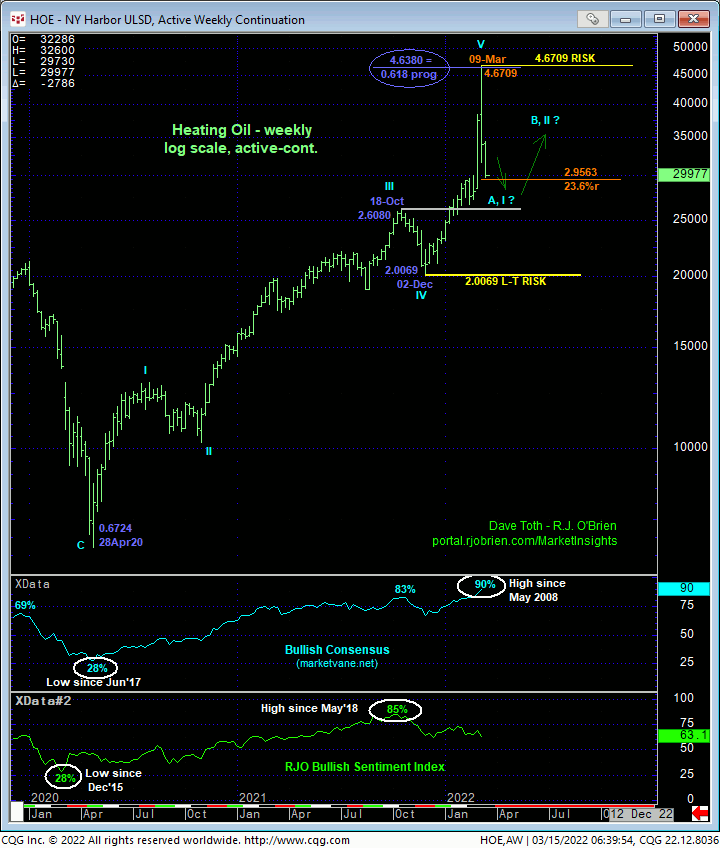
- historically frothy sentiment/contrary opinion levels like the current 90% reading in the Bullish Consensus (marketvane.net), its highest level since May 2008
- an arguably compete 5-wave Elliott sequence on a massive scale dating from Apr’20’s 0.6724 low as labeled in the weekly log chart below, where
- the prospective completing 5th-wave from 02-Dec’s 2.0069 low came within a little over 3-cents of its (4.6380) 0.618 progression of the net distances of Waves-I-thru-III (0.6724 – 2.6080).
At best however, the market has satisfied only the first two of our three key reversal requirements: a bearish divergence in momentum of a scale sufficient to threaten the major uptrend and proof of trendy, impulsive price action lower. To truly reinforce a major peak/reversal process and opportunity, we need the key third of these requirements to be satisfied: proof of 3-wave corrective behavior on a subsequent recovery attempt that is stemmed by a bearish divergence in momentum from a level shy of 09-Mar’s 4.6709 high and new key long-term bearish risk parameter.
These issues considered, a neutral/sideline policy remains advised as we believe the risk/reward merits of chasing bearish exposure lower at this point or poor, even with a tighter bear risk parameter being defined at 3.5229. Further lateral-to-lower prices remain anticipated however, but we will be watchful for a relapse-stemming bullish divergence in short-term mo for at least an interim opportunity from the bull side for a B- or 2nd-Wave correction higher that could be extensive in terms of price and time.
APR CRUDE OIL
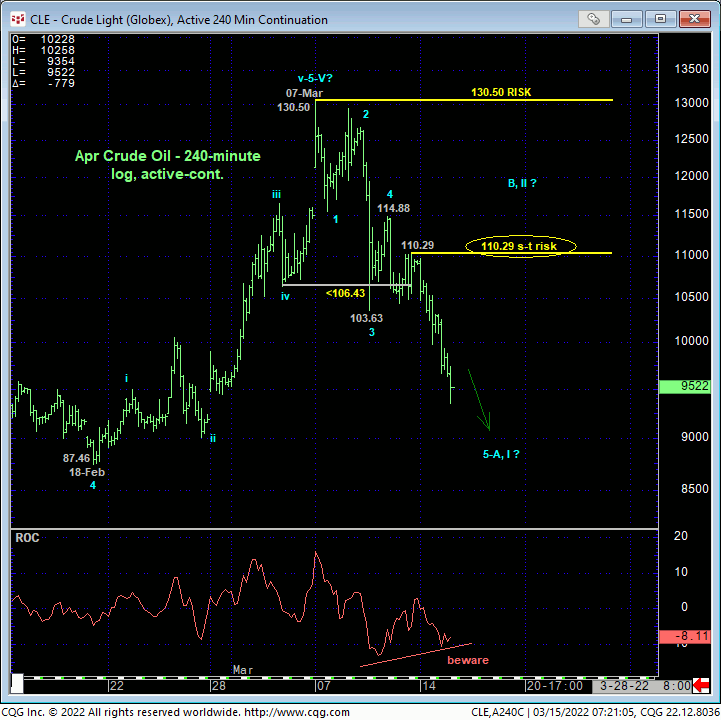
The technical construct in crude oil is identical to that detail above in diesel with this week’s accelerated losses leaving Fri’s 110.29 high in its wake as the latest smaller-degree corrective high and new short-term risk parameter this market is now required to recoup to confirm a bullish divergence in short-term mo and expose at least a B- or 2nd-Wave correction of the sell-off from 07-Mar’s 130.50 high and possibly a resumption of the secular bull trend. Per such, this 110.29 level serves as our new short-term risk parameter from which non-bullish decisions like long-covers and cautious bearish punts can now be objectively based and managed.
From a longer-term perspective shown in the daily log chart below, this week’s setback s obviously too big to be considered a smaller-degree 4th-Wave correction of the portion of the bull trend from 18-Feb’s 87.46 low. Indeed, the past week’s decline is clearly big enough to be AT LEAST the A-Wave of a correction of Dec-Mar’s entire 62.43 – 130.50 rally that is just getting started. A potentially extensive B-Wave corrective rebuttal higher would be expected somewhere along the line, with a recovery above 07-Mar’s 130.50 high now clearly needed to negate this count and reinstate the secular bull.
At most, the past week’s decline is the 1st-Wave of a peak/reversal process that would be major in scope. A 2nd-Wave corrective rebuttal would still be expected and could be extensive, but the risk/reward opportunities from the bear side could be long-lived. Of course, last week’s 130.50 has resulted from the past week’s swoon as this market’s single most important technical level as this is obviously the level the market now needs to recoup to mitigate any peak/reversal counts and reinstate the secular bull market to then-indeterminable heights. Until and unless such 130.50+ strength is shown, we believe the market questioned the risk/reward merits of a longer-term bullish count enough to more greatly consider a peak/reversal count.
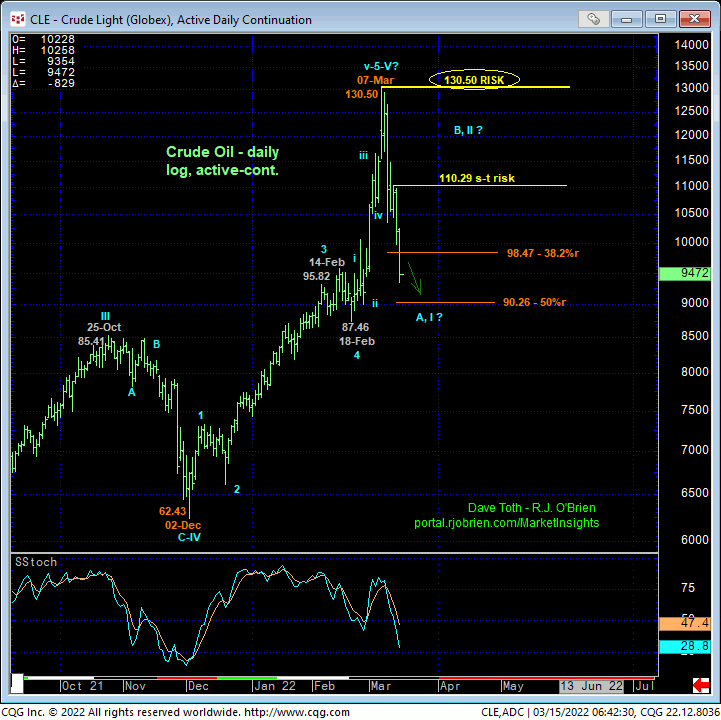
Here too and very interestingly, it’s notable that last week’s 130.50 high came within a measly 19-cents from the (130.69) 2.618 progression of Apr-Aug’20’s 6.50 – 43.78 1st-Wave rally from Nov’20’s 33.64 2nd-Wave low in what is arguably a complete and massive 5-wave Elliott sequence as labeled below. Again, given the massive nature of the nearly-two-year bull, it would certainly be premature to conclude last week’s 130.50 high as the end of the entire move. But for reasons specified above and with the still-required-proof of 3-wave corrective behavior on a subsequent recovery attempt, we believe the risk/reward merits of a long-term bullish policy have eroded enough to flip to a new bearish count, with a recovery above 130.50 required to negate this call.
These issues considered, a neutral/sideline policy remains advised as the risk/reward merits of chasing bearish exposure lower are poor. We will be watchful for a sell-off-stemming bullish divergence in short-term momentum for a favorable, if interim risk/reward punt from the bull side to participate in the expected B- or 2nd-Wave corrective rebound or possibly a resumption of the secular bull. In the meantime, further losses should not surprise.
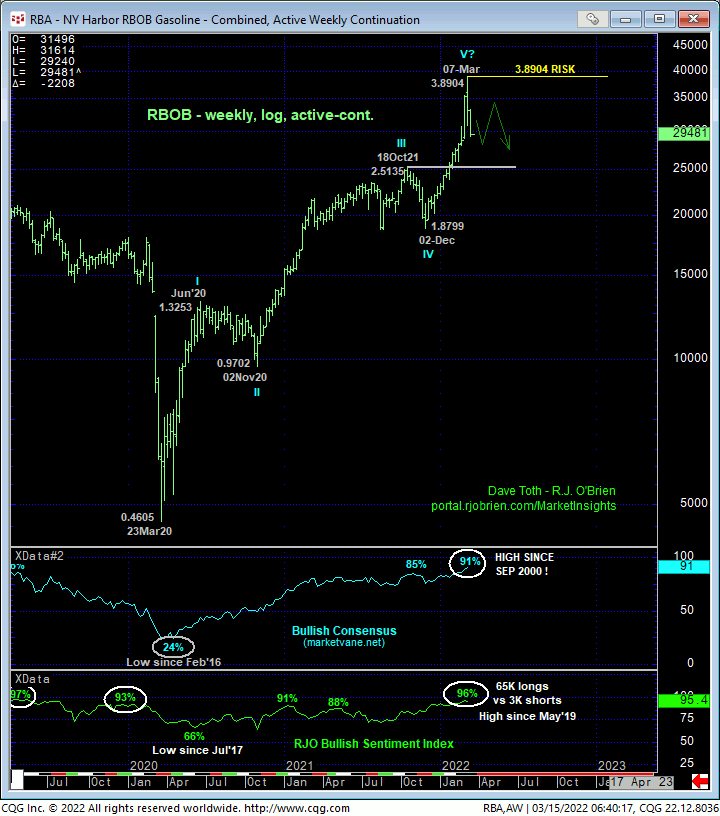
APR RBOB
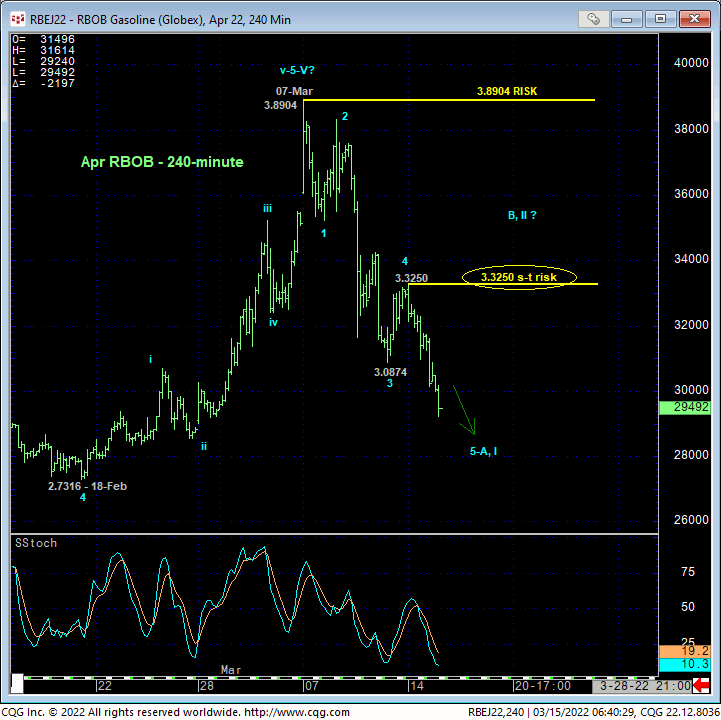
The extent and impulsiveness of this week’s continued slide in RBOB, along with understandably extreme bullish sentiment, present an identical technical construct and expectations as those detailed above in crude and diesel, with yesterday’s 3.3250 high and last week’s 3.8904 high serving as our new short- and long-term risk parameters from which to navigate a major peak/reversal process.
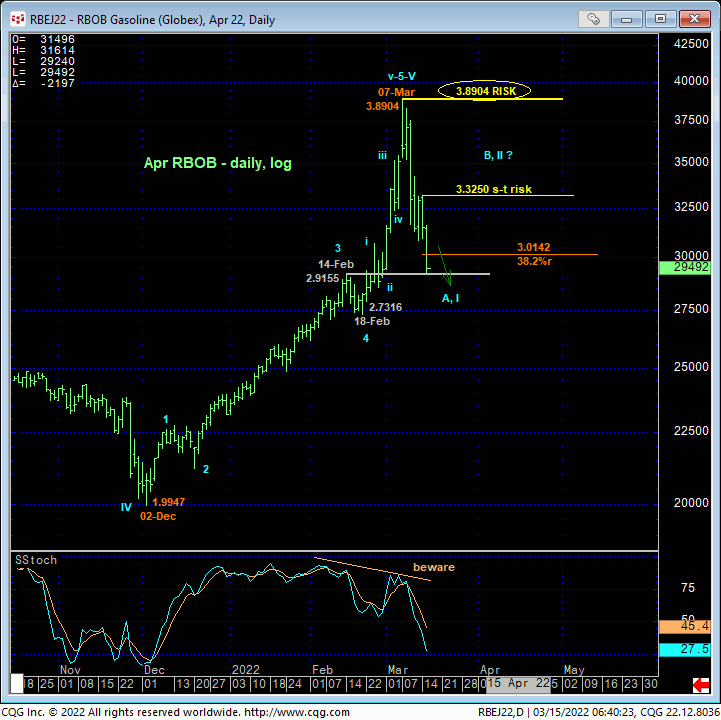
The weekly log chart below shows the stratospheric heights our two sentiment/contrary opinion indicators have reached along with the prospect that 07-Mar’s 3.8904 high completed a massive 5-wave Elliott sequence from Mar’20’s 0.4605 low. As with other two markets, we will be watchful for a relapse-stemming bullish divergence in short-term momentum that would expose at least a B- or 2nd-wave corrective rebound that could be extensive or a resumption of the secular bull market. In either event, the interim risk/reward merits on such a bullish punt could be very favorable. In lieu of such s bullish divergence in short-term mo, further losses remain expected but a neutral/sideline policy remains advised.