MAY CRUDE OIL
Fri’s break above last Wed’s 62.99 high reaffirms the major uptrend and leaves Fri’s 61.82 low in its wake as the latest smaller-degree corrective low and new short-term risk parameter this market is now minimally required to fail below to even defer, let alone threaten the major bull. Former 63.00-to-62.75-area resistance is considered new near-term support ahead of further and possibly accelerated gains.
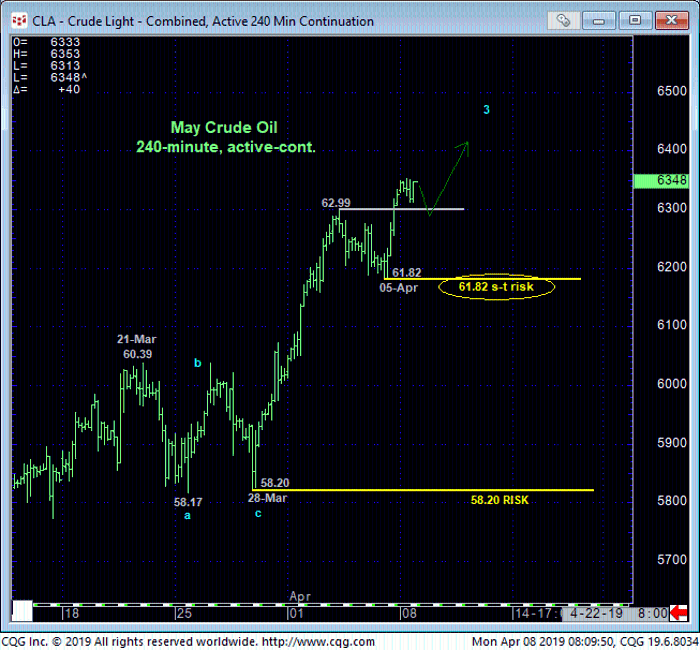
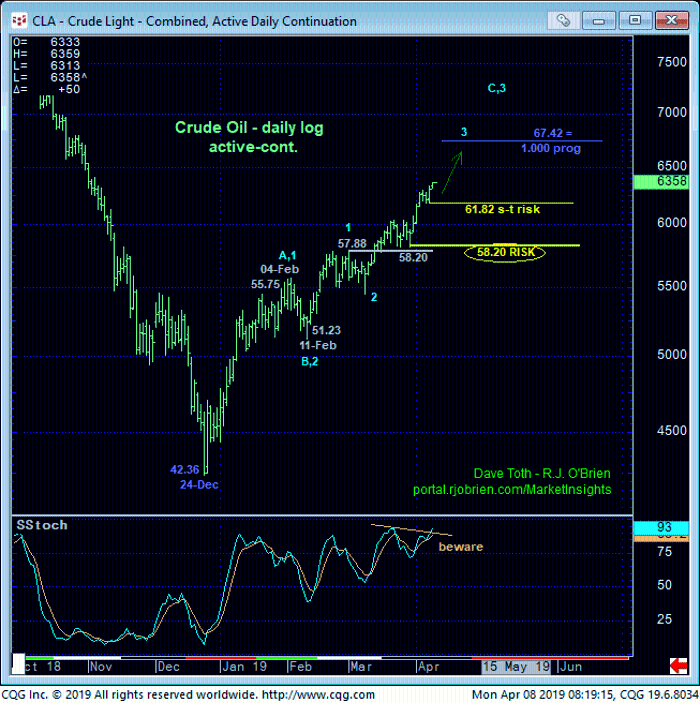
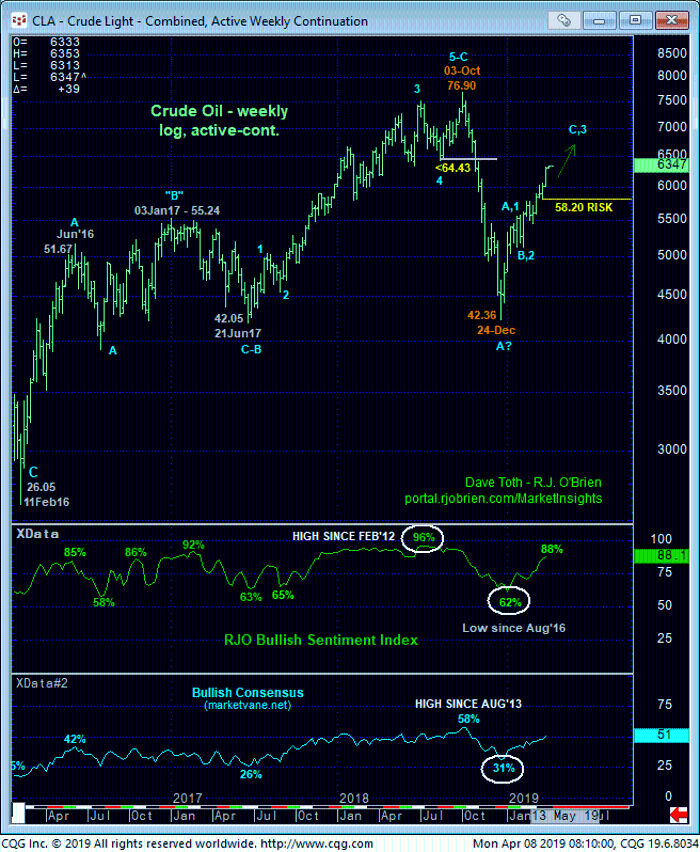
The daily (above) and weekly (below) log scale charts show the magnitude of the clear and present uptrend with commensurately larger-degree weakness below 28-Mar’s 58.20 next larger-degree corrective low required to confirm a bearish divergence in momentum on a scale sufficient to break the major uptrend. Per such this 58.20 level serves as our long-term risk parameter to a still-advised bullish policy for long-term players.
The weekly chart also shows understandably higher bullish sentiment levels that have warned of broader peak/reversal environments in the past. But traders are reminded that sentiment/contrary opinion is not an applicable technical tool in the absence of an accompanying bearish divergence in momentum needed to, in fact, stem the uptrend and reject/define a specific high and resistance from which non-bullish decisions can only then be objectively based and managed. herein lies the importance of corrective lows and risk parameters like 58.20.
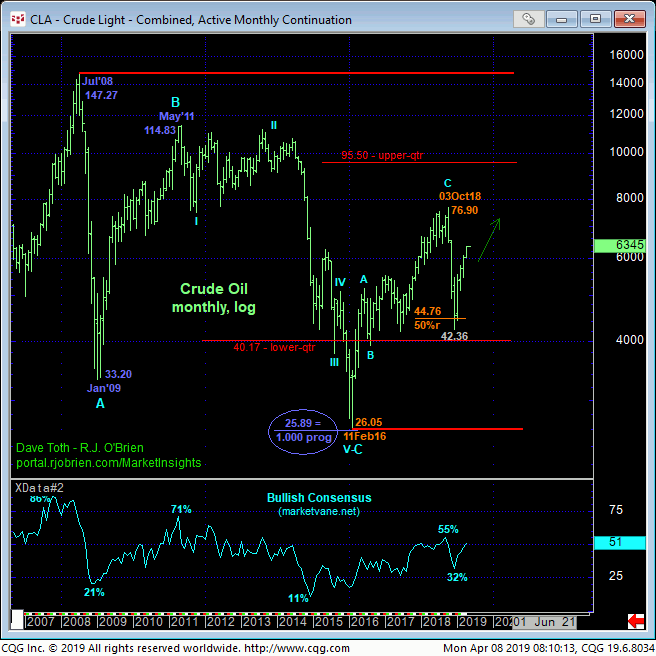
Finally, the monthly log chart below shows the market deep within the middle-half bowels of its historical 11-year lateral range where, from a multi-quarter perspective, almost anything can happen. Quarters of aimless whipsaw risk to a continued sharp rally to the 80-area or above should be considered in play.
In sum, a full and aggressive bullish policy remains advised with a failure below 61.82 required for shorter-term traders to move to the sidelines and longer-term players to pare bullish exposure to more conservative levels. Commensurately larger-degree weakness below 58.20 remains required for long-term players to jettison bullish exposure altogether. In lieu of such weakness further and possibly accelerated gains remain expected.
MAY HEATING OIL
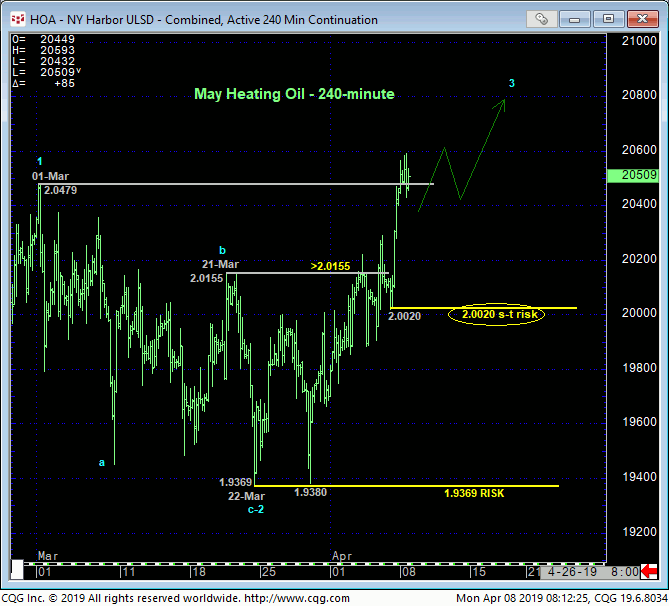
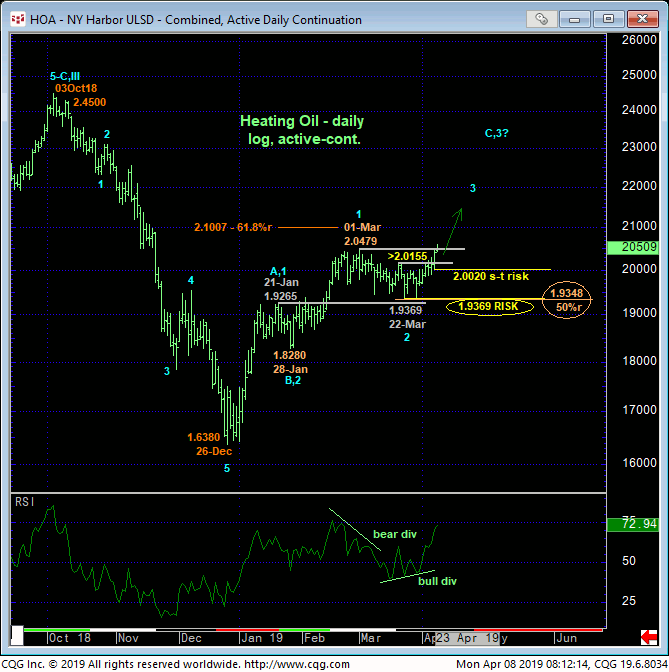
Overnight’s break above 01-Mar’s 2.0479 high confirms our bullish count discussed in last Wed’s Technical Blog and leaves Fri’s 2.0020 low in its wake as the latest smaller-degree corrective low this market is now minimally required to fail below to jeopardize the impulsive integrity of a broader bullish count. Per such this 2.0020 low is considered our new short-term risk parameter from which an advised bullish policy can be objectively rebased and managed by shorter-term traders with tighter risk profiles.
By breaking above 01-Mar’s 2.0479 high, the daily log scale chart below shows the market’s confirmation of Mar’s sell-off attempt from 2.0479 to 22-Mar’s 1.9369 low as a corrective bull-flag pattern within the major uptrend that dates from 26Dec18’s 1.6380 low and may have huge upside potential remaining. Former 2.0475-to-2.0150-range resistance is expected to provide huge support heading forward. 22-Mar’s 1.9369 larger-degree corrective low serves as our new key long-term risk parameter for longer-term players.
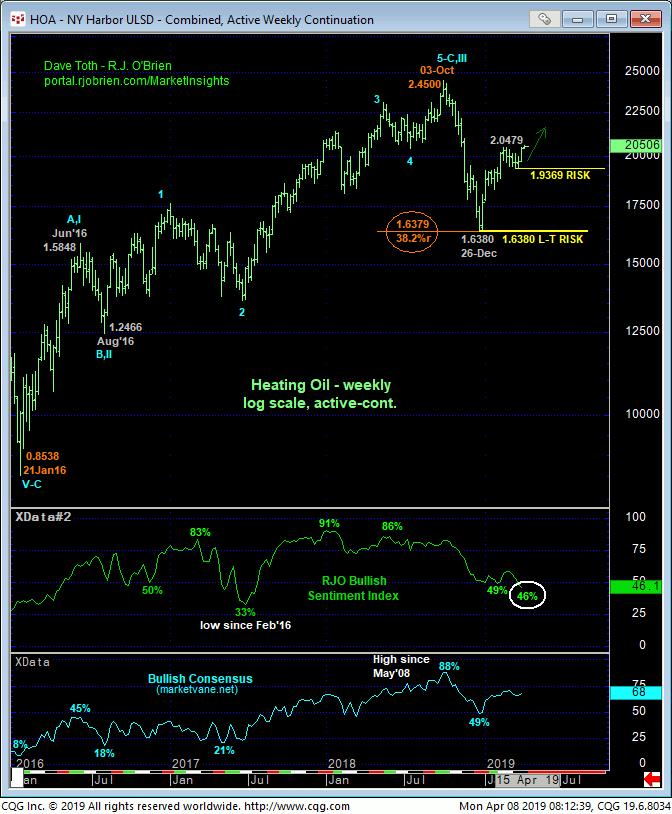
Interestingly and opportunistically (for bulls, at least), the weekly log chart above shows last week’s continued EROSION in our RJO Bullish Sentiment Index of the hot Managed Money positions reportable to the CFTC DESPITE merely lateral, flagging prices. This is the LOWEST level since the Jul’17 period stemming from the market’s major reversal of a six-month correction that warned of a vulnerability to higher prices then and we believe so again now. Indeed, we believe the extent to which the Managed Money community has its collective neck sticking out on the bear side DESPITE the market maintaining/reinstating its 3-month uptrend could see the overall market force the capitulation of this bearish exposure and exacerbate the bull.
These issues considered, a full and aggressive bullish policy remains advised with a failure below 2.020 required for shorter-term traders to move to the sidelines and for longer-term players to pare bullish exposure to more conservative levels. IN lieu of such weakness further and possibly explosive gains should not surprise.
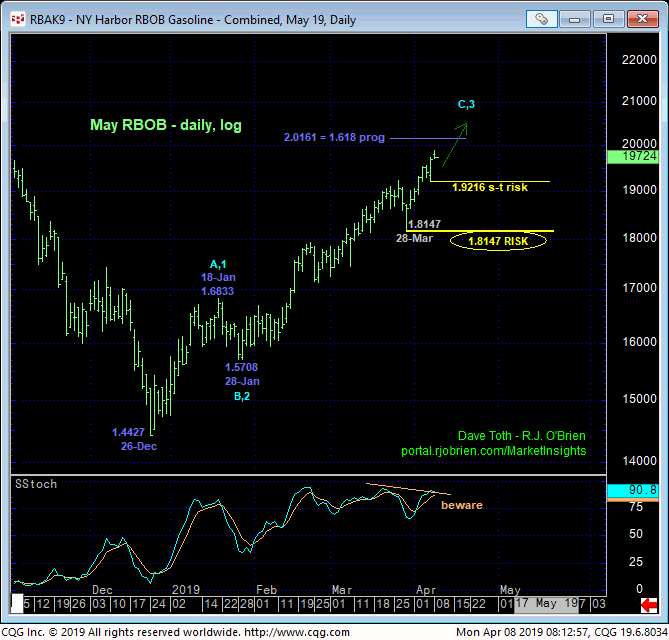
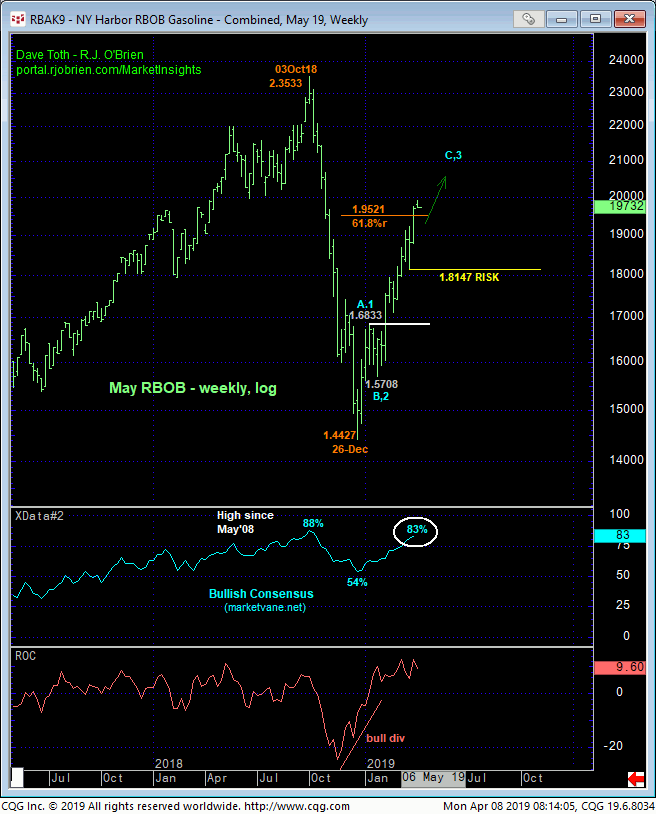
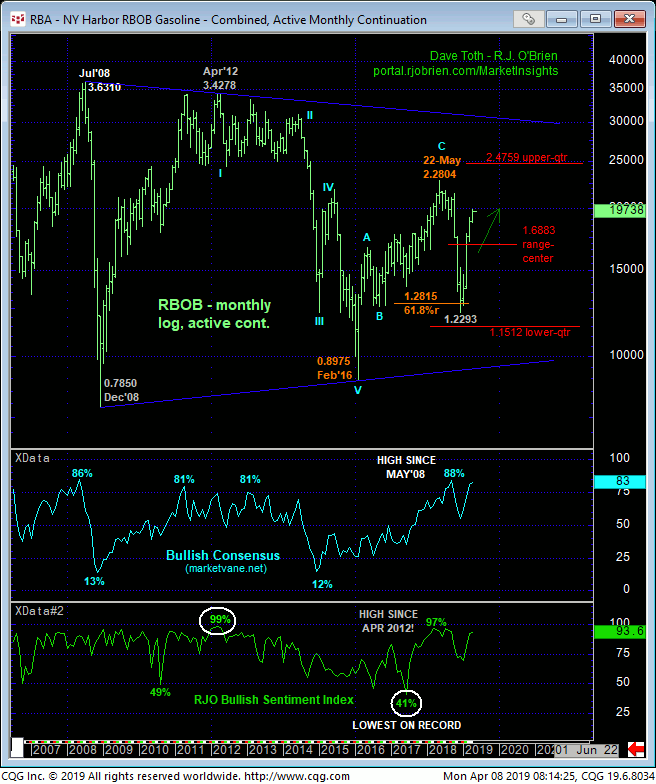
MAY RBOB
