
Posted on Aug 26, 2022, 07:32 by Dave Toth
OCT CRUDE OIL
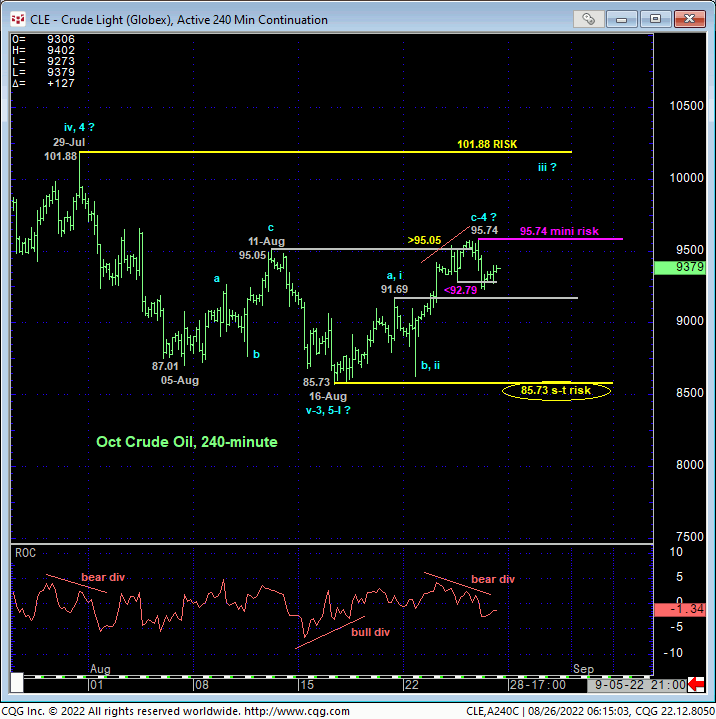
A day after recouping 11-Aug’s 95.05 corrective high that defines 16-Aug’s 85.73 low as one of developing importance and a short-term bull risk parameter, the 240-min chart below shows yesterday’s slip below Wed’s 92.79 very minor corrective low that confirms a bearish divergence in very short-term momentum. This defines yesterday’s 95.74 high as possibly the end of another 3-wave corrective hiccup within the past 2-1/2-months’ broader slide and a mini parameter from which the risk of bearish decisions can be objectively based and managed, albeit on a very minor scale.
This degree of granularity is arguably misguided and invites whipsaw risk, especially from deep within the middle-half bowels of the past month’s lateral range. But as we’ll discuss below and as we’ve recently cited, the 95-handle-area remains a potentially key resistance candidate within the broader downtrend that yesterday’s 95.74 intra-day high might have capped. To threaten or break Jun-Aug’s broader downtrend, we believe this market must at least close above the 95.-handle in general and/or break above 29-Jul’s 101.88 larger-degree corrective high on an intra-day basis. On the heels of yesterday’s admittedly mini bearish divergence in mo, further erosion below last Fri’s 91.69-area high/resistance-turned-support would be the next step towards a resumption of Jun-Aug’s downtrend, with an ultimate break below 85.73 confirming the resumed bear.
In effect and after all of the gobbledygook, we believe this market has specified three levels- 85.73, 95.74 and 101.88 – as the key flexion points around which directional biases and exposure can be objectively based and managed commensurate with one’s personal risk profile.
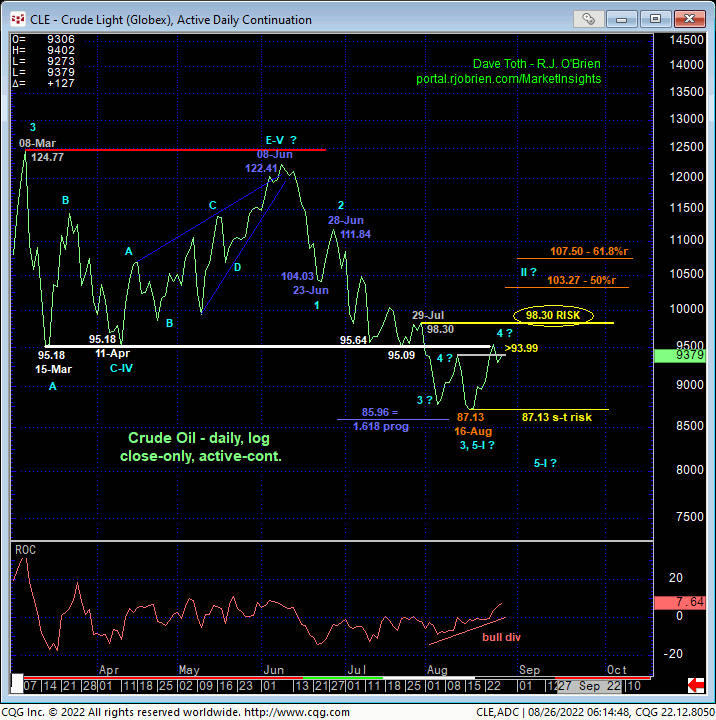
The daily log close-only chart below clearly shows the 95-handle-area as a key former area of support that dates from mid-Mar that, since broken in early-Aug, now serves as a key new resistance candidate. We discussed the likely confirmation of a bullish divergence in daily momentum in Tue’s Technical Webcast on a suspected close above 11-Aug’s 93.99 corrective high close. This is clear and defines 16-Aug’s 87.13 low close (85.73 intra-day low) as one of developing importance and the obvious short-term bull risk parameter this market needs to sustain gains above to maintain the prospect for a steeper (suspected 2nd-Wave correction) recovery in the weeks ahead.
HOWEVER, given the confusing number of iterative corrective hiccups all the way down from 28-Jun’s 111.84 high, it is indeterminable at this juncture if those 16-Aug lows completed five waves down from 08-Jun’s 122.41 high or only three. Until larger-degree proof of strength above at least the 95-handle and especially 29-Jul’s 98.30 larger-degree corrective high close (101.88 on an intra-day basis), this month’s thus-far labored recovery attempt easily falls within the bounds of a mere 4th-Wave correction ahead of a 5th-Wave resumption of the 2-1/2-month downtrend to new lows below 85.73.
As is not uncommon at such correction-vs-reversal crossroads, this situation emphasizes the key technical and trading issue of SCALE. The short-term trend is up within the long-term trend that remains arguably down, with 85.73 and 101.88 the key directional flexion points.
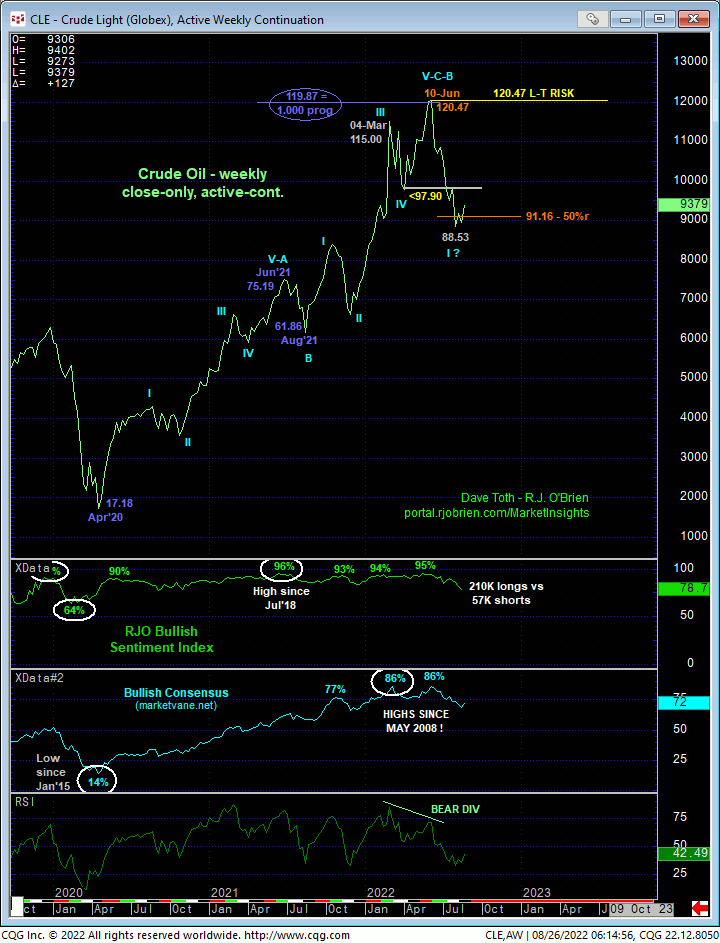
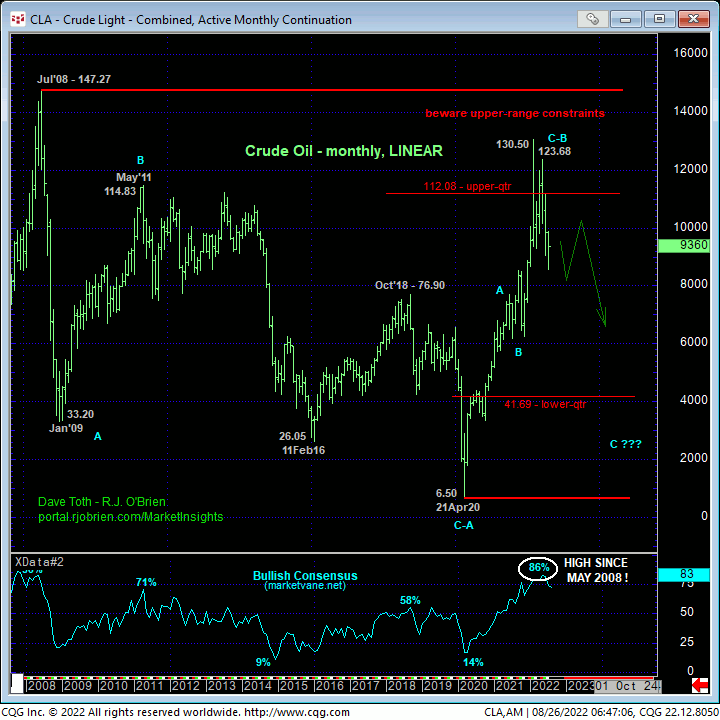
From a long-term perspective, traders are reminded of the major peak/reversal elements still in place that still weigh on this market:
- a confirmed bearish divergence in WEEKLY momentum amidst
- what was historically frothy sentiment/contrary opinion levels
- a textbook complete 5-wave Elliott sequence from Aug’21’s 61.86 corrective low weekly close that
- spanned a virtually identical length (i.e. 1.000 progression) to Apr’20 – Jun’21’s preceding rally from 17.18 to 75.19, and
- the market’s total rejection of the upper-quarter of its historical range.
This is a unique and compelling list of factors typical of major peak/reversal environments. This does not mean however that there won’t or can’t be corrective rebounds that could be extensive in terms of price and time. And herein lies the importance of our larger-degree bear risk parameter at 101.88.
These issues considered, a cautious bearish policy and exposure remain advised for longer-term commercial players with an intra-day recovery above 101.88 and/or a close above 98.30 required to negate this call and warrant its cover. A neutral-to-cautiously-bullish policy remains advised for shorter-term traders with a failure below 85.73 required to negate this call and warrant its cover. For even shorter-term traders, toggle directional punts around yesterday’s 95.74 high, cautious short below, cautious long above.
OCT HEATING OIL
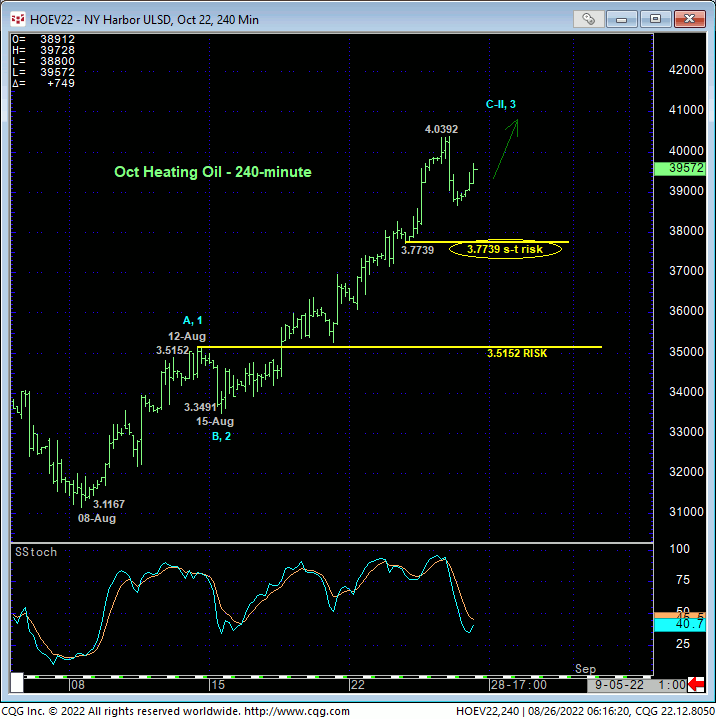
UNlike mothership crude oil, only a glance at the 240-min chart above and daily log chart below of heating oil is needed to see how that “more extensive” corrective recovery or possibly a resumption of the secular bull market has unfolded since introduced in 17-Aug’s Technical Webcast following that day’s bullish divergence in daily momentum. As a result of Wed and yesterday’s continuation of this rally that has now engaged the upper-quarter of the past quarter’s range, the market has identified a minor corrective low at 3.7739 from late-Tue that we believe it now needs to sustain gains above to maintain the impulsive integrity of a continued bullish count. We feel a failure below 3.7739, especially after poking into the upper-quarter of this summer’s range, will compromise the risk/reward merits of a continued bullish policy enough to warrant moving to at least a neutral/sideline position. Per such, 3.7739 is considered our new short-term but key risk parameter from which an interim bullish policy and exposure can be objectively rebased and managed. Until and unless such weakness is shown, further and possibly accelerated gains should not surprise, including the possible resumption of the secular bull trend above 4.2595 in the Oct contract.
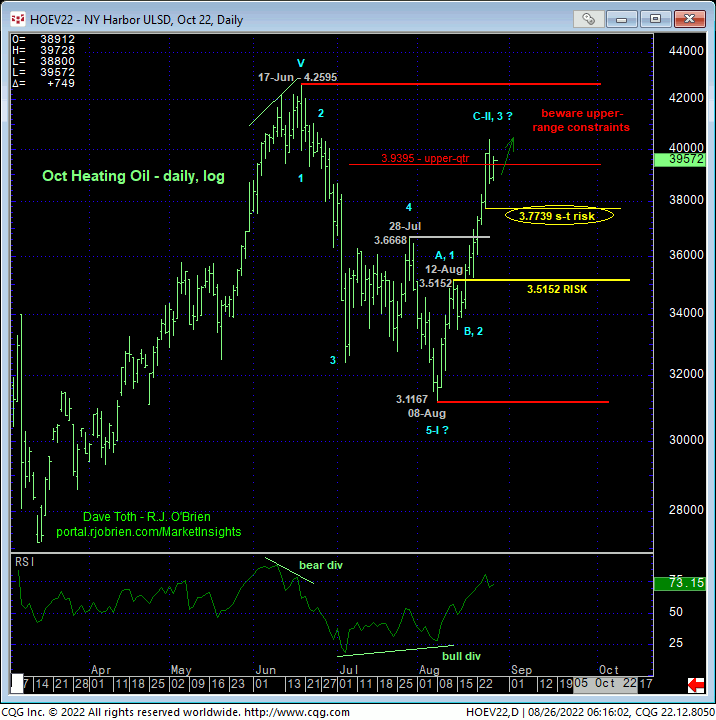
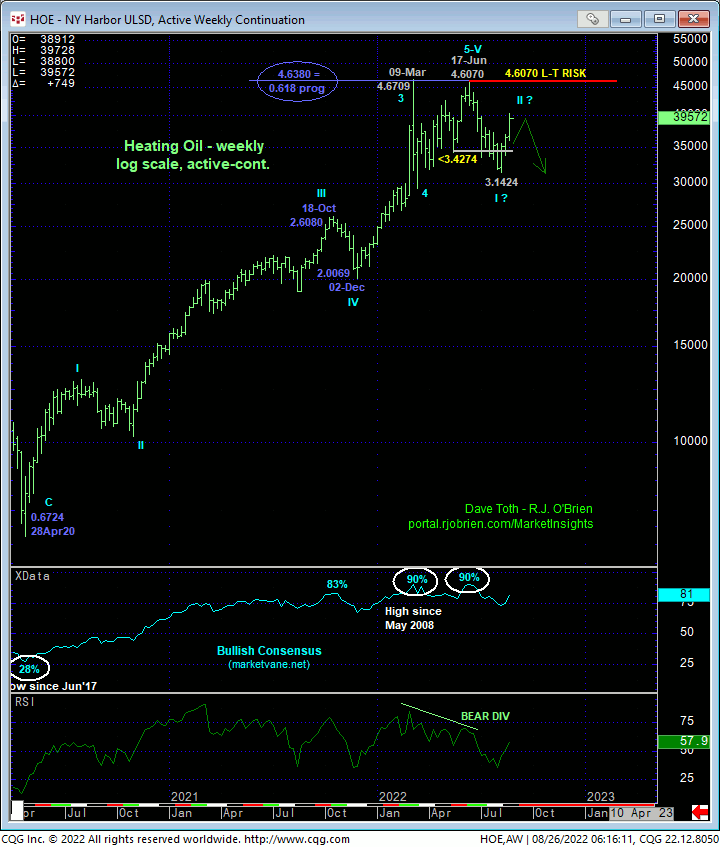
From a longer-term perspective and similar to crude oil, major peak/reversal elements (momentum, sentiment, waves, Fibs) remain in place until negated by a recovery above 17-Jun’s 4.6070 high. This current recovery is either a 2nd-Wave correction of Jun-Aug’s (1st-Wave) decline OR a 5th-Wave resumption of the secular bull. If the latter is what this market has in mind, it’s imperative for the bull to continue to behave like one with sustained, trendy, impulsive behavior higher. A rally-countering bearish divergence in momentum from “anywhere up here” will be the first sign of that broader peak/reversal count that, given the extent of this recovery, could present a fantastic risk/reward opportunity from the bear side.
These issues considered, a cautious bullish policy remains advised with a failure below 3.7739 require to threaten this count enough to warrant moving back to a neutral/sideline position.
OCT RBOB
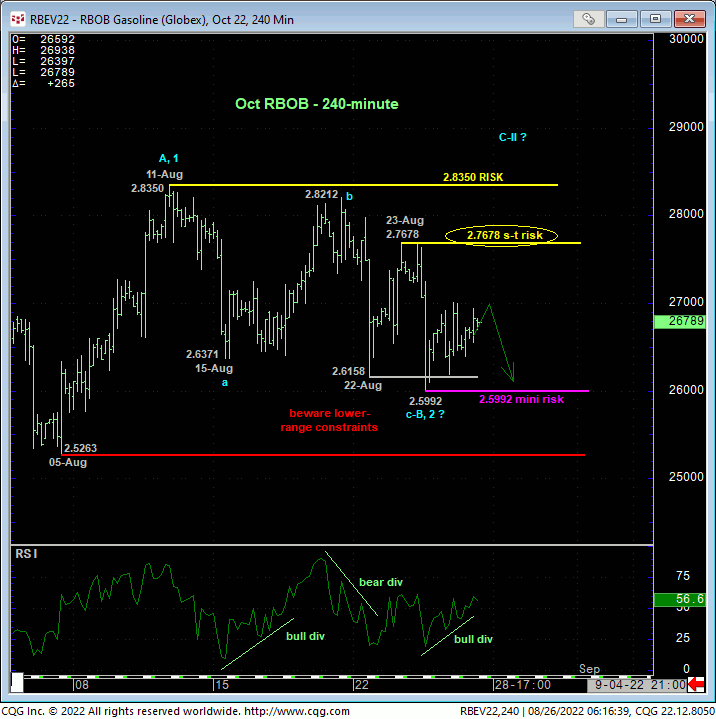
The labored, shallow extent to which this market has tried to recover from 05-Aug’s 2.5263 high equates it more to the technical construct of crude oil, requiring a recovery above at least Tue’s 2.7678 smaller-degree corrective high to flip the script higher. And even then, subsequent and commensurately larger-degree strength above 11-Aug’s 2.8350 high would remain required to render that high an initial counter-trend high needed to confirm a bullish divergence in DAILY momentum needed to, in fact, break Jun-Aug’s downtrend and expose a larger-degree (suspected 2nd-Wave) correction high.
From a very short-term perspective, yesterday’s bounce confirmed a bullish divergence in very short-term momentum that defines Wed’s 2.5992 low as one of developing importance, especially from the lower recesses if this month’s range, that serves as a mini risk parameter from which a cautious bullish punt can be objectively based and managed.
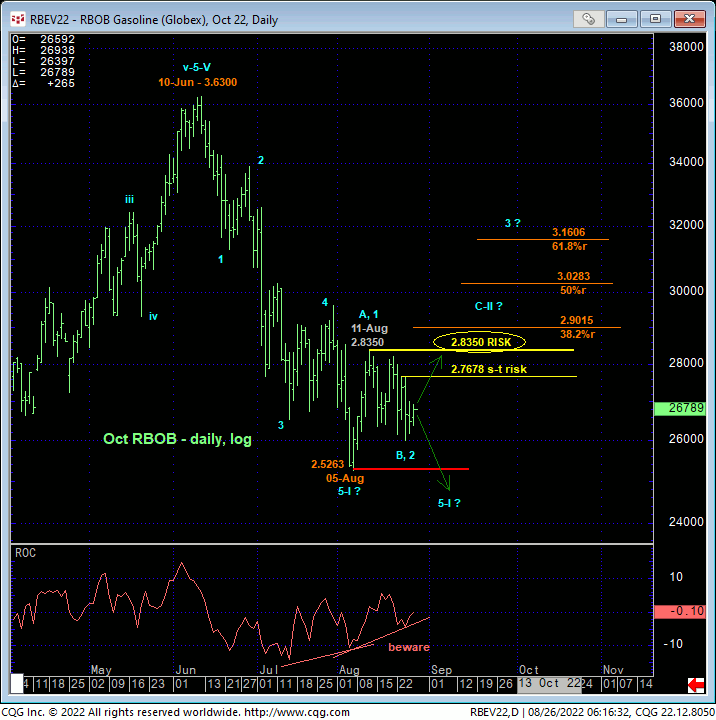
From a much longer-term perspective, if there’s a time and place for this market to correct higher, it has to be here and now around the (2.5846) 61.8% retrace of Dec’21 – Jun’22’s 1.8799 – 4.3260 rally and area of former 2.5135-area resistance-turned-support from 4Q21 shown in the weekly log chart below. Herein lies the importance of 11-Aug’s 2.8350 high this market needs to recoup to confirm a bullish divergence in momentum, break Jun-Aug’s downtrend and expose the recovery. Until and unless such strength is shown, this month’s mere lateral and shallow recovery attempt is easily seen as a corrective/consolidative bear flag that warns of a resumption of Jun-Aug’s downtrend that preceded.
These issues considered, a neutral-to-cautiously-bearish stance remains advised with a recovery above at least 2.7678 and especially 2.8350 required to threaten and then negate this call and expose the reversal higher. A cautious bullish punts would also be OK for very short-term traders with a failure below 2.5992 negating this call and warranting its cover. A break below 05-Aug’s 2.5263 low obviously reinstates the downtrend that could be just the start of a major peak/reversal threat from Jun’s 4.3260 high.


