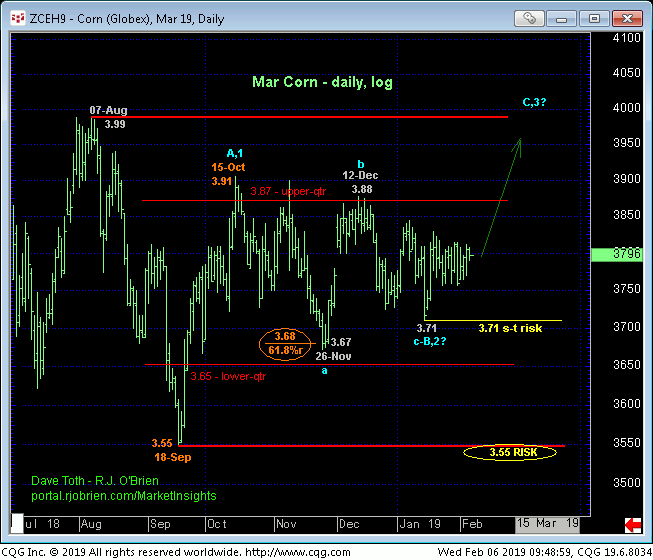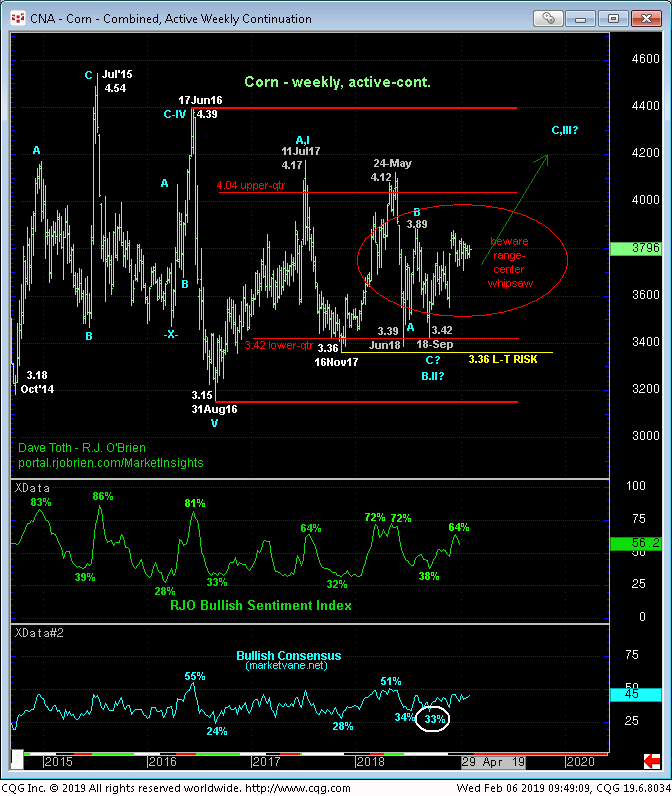

The market’s mere lateral chop hasn’t altered any of the technical merits since our last Technical Blog from 18-Jan. The market hasn’t produced any evidence to threaten or nullify our major base/reversal count, so we anticipate an eventual upside breakout above at least 4Q18’s 3.88-to-3.91-area highs and resistance and eventually above 2016 and 2015 highs at 4.39 and 4.54. Weakness below 15-Jan’s 3.71 low is minimally required to even defer this count, let alone threaten it. Commensurately larger-degree weakness below Nov’17’s 3.36 low and our long-term risk parameter remains required to threaten this bullish count for the sake of very long-term players like end-users and producers.
This said, the market’s position still deep within the middle-half bowels of the incessant FOUR YEAR range maintains the odds of aimless whipsaw risk and this market staying imprisoned within this range indefinitely. But heading into Fri’s key USDA crop reports that have been deferred for weeks because of the government shutdown, there’s no way to know that this market isn’t wound tighter than Dick’s hatband and ready to explode in either direction. For the technical reasons we’ve cited for many months however, we believe traders have a compelling risk/reward opportunity from the bull side.


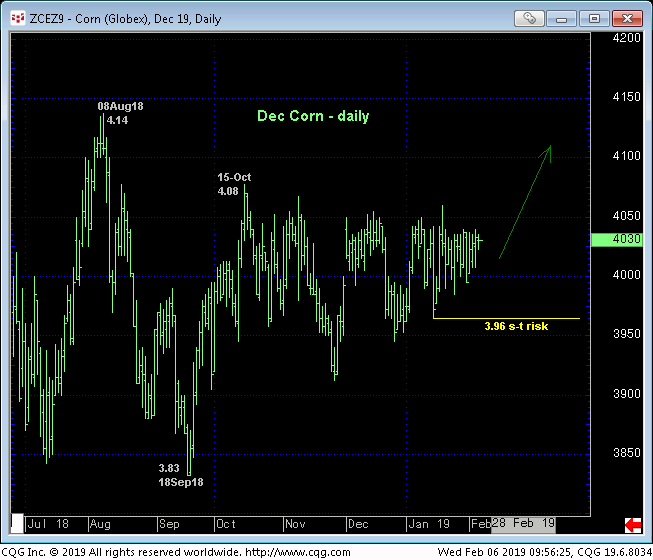
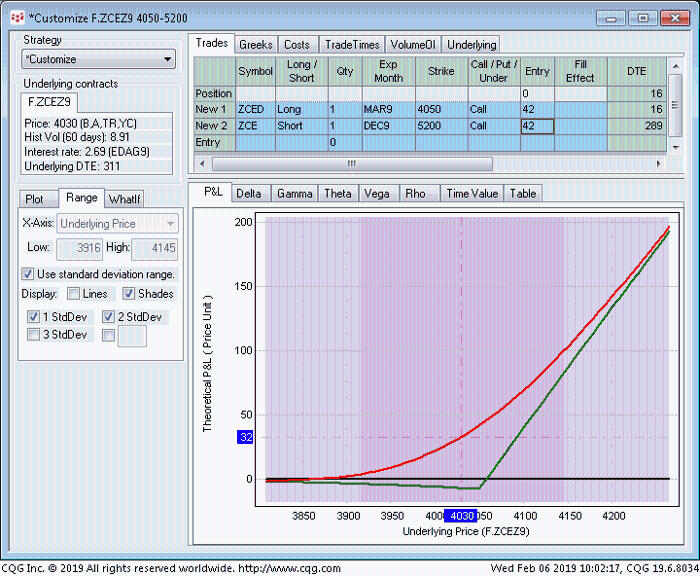
Given that it’s a prime time of the year for the use of the CME’s short-dated option on the new crop Dec19 contract shown in the daily chart above, an outstanding gamma opportunity exists between the Mar short-dated calls and the actual Dec calls. Specifically, we recommend buying the Mar short-dated 4.05 calls (that are only a smidge out-of-the-money) for around 4-1/4-cents and selling the Dec 5.20 calls around the same 4-1/4-cents for a net cost of “even”. This strategy provides:
- a current net delta of +0.42
- whopping gamma ratio of 21:1
- negligible risk if we’re wrong on a bullish count and the underlying Dec contract collapses
- profit potential of a 1.15 if the market rallies and sustains gains above 4.05.
As always with long-gamma strategies, this tremendous gamma advantage comes in exchange for theta, or time decay risk, as the Mar short-dated options expire in just 16 days on 22-Feb while the Dec options don’t expire until 22-Nov 289 days from now. This allows for the opportunity for the long short-dated calls to expire worthless if the market doesn’t take off while leaving the short Dec call position in place, exposing potentially unlimited risk. But we never let this position get to that point, electing to cover the entire strategy for what should be a small loss if the market doesn’t show its bullish directional hand over the course of the next week-and-a-half.
Please contact your RJO representative for an updated bid/offer quote on the Mar short-dated 4.05 / Dec 5.20 Call Diagonal.


