In 19-Jul’s Corn Technical Blog we introduced the prospect for a base/reversal-threat environment that could mean surprising gains for weeks or even months ahead. Given the typically and generally positive correlation between corn and ethanol, similar base/reversal-threat evidence in ethanol should not come as too much of a surprise.
In 10-Jul’s Ethanol Technical Blog, we discussed a bullish divergence in the then-prompt Aug contract that left 02-Jul’s 1.393 low in its wake as the END of the decline from 23-May’s 1.543 high. That 1.393 low remained intact ahead of yesterday’s close above 06-Jul’s 1.439 initial counter-trend high that has satisfied all three of our key reversal requirements.
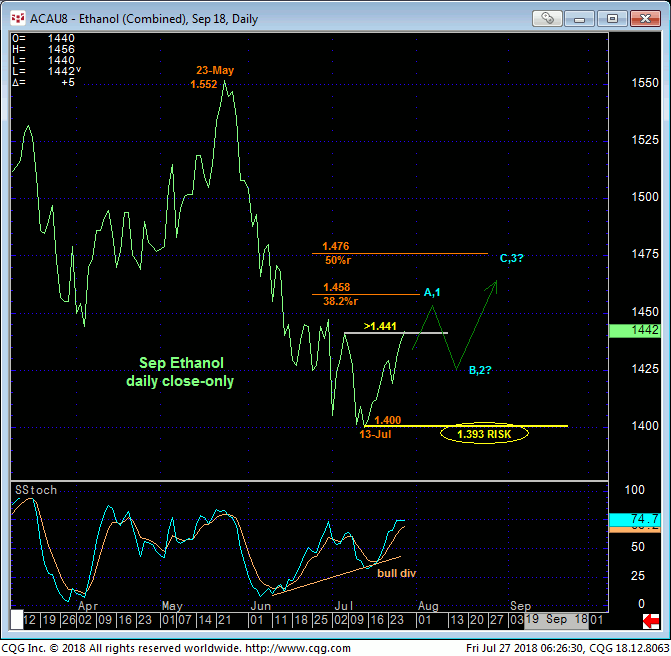
In the now-prompt Sep contract however, the market posted a new low for the May-Jul downtrend with Friday the 13th’s 1.400 low close shown in the daily close-only chart below. This resumed break left 06-Jul’s 1.441 high in its wake as the latest corrective high and key risk parameter the market needed to sustain losses below to avoid confirming a bullish divergence in momentum. The market has been trading above this level overnight, and given the developing ethanol and corn evidence of a base/reversal environment, we’re going to conclude 13-Jul’s 1.400 low as the END of the decline from 23-May’s 1.552 high in the now-prompt Sep contract and our new key risk parameter from which non-bearish decisions like short-covers and cautious bullish punts can now be objectively based and managed.
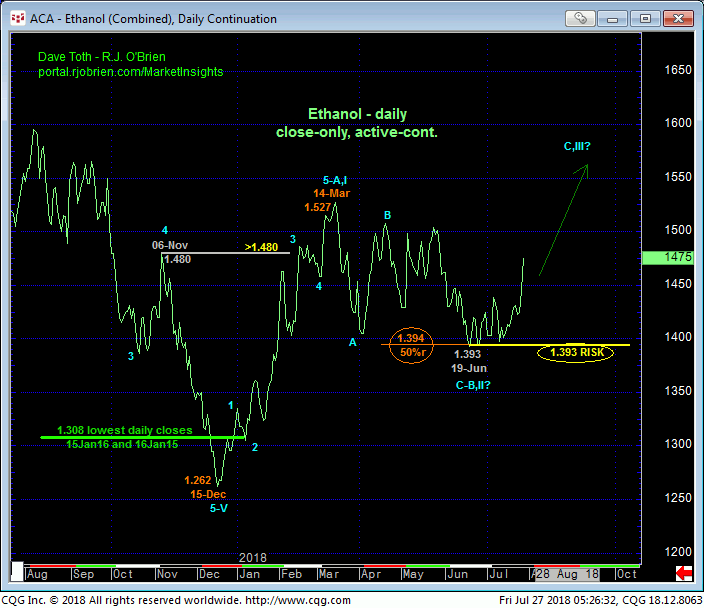
Compellingly, and after the market’s gross failure to sustain new multi-year lows in mid-to-late-Dec, the daily active-continuation chart below shows:
1. a confirmed bullish divergence in WEEKLY momentum above 06Nov17’s 1.480 high
2. trendy, impulsive 5-wave behavior in the initial rally from 15-Dec’s 1.262 low to 14-Mar’s 1.527 high and
3. textbook 3-wave behavior on the subsequent relapse attempt to 19-Jun’s 1.393 low in the then-prompt Jul contract.
This six-month price action satisfies our three key reversal requirements on a major scale. The Fibonacci fact that that 19-Jun low is also the exact 50% retrace of Dec-Mar’s rally adds reinforcing gravy to this long-term bullish count and the importance of that 1.393 level as a key risk parameter.
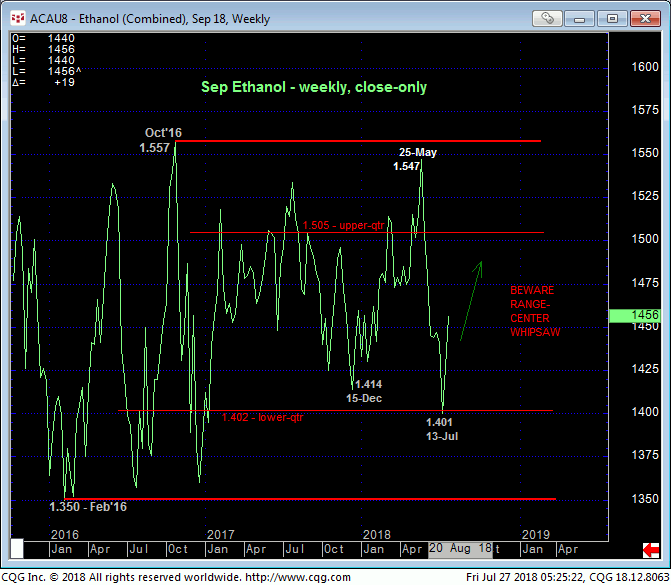
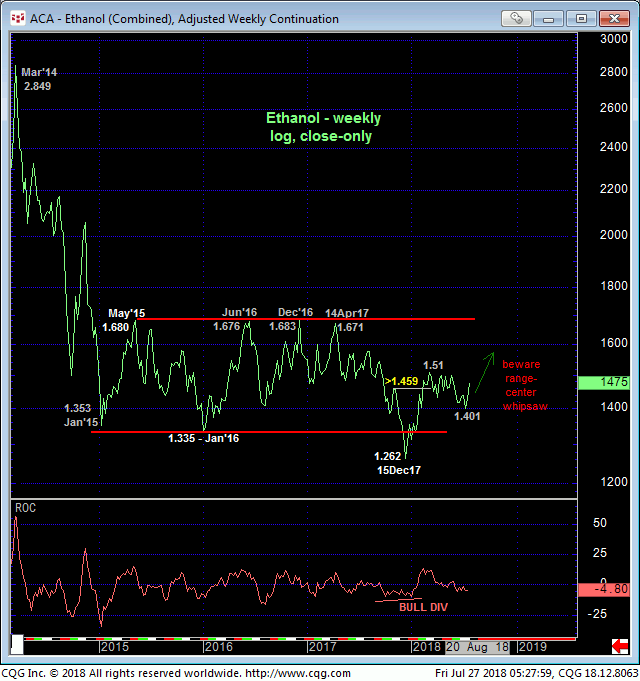
The weekly close-only chart of the Sep contract shows its rejection thus far of the lower-quarter of the multi-year range that also contributes to our base/reversal count. Basis both the Sep contract and on an active-continuation chart basis below, the market remains deep within the middle-half bowels of a 3-1/2-year range where further aimless whipsaw risk should not come as a surprise. Herein lies the importance of identifying a tight but objective risk parameter- like 1.393- from which a proposed bullish policy can be objectively based and managed.
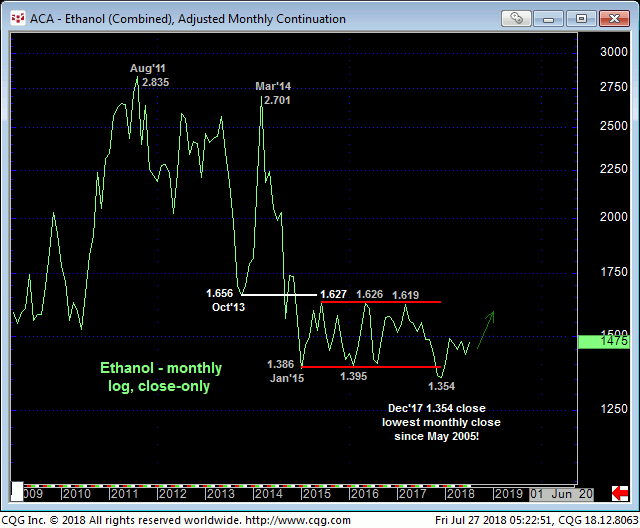
Finally, on a historic basis shown in the monthly log close-only chart below, the market’s gross failure to sustain new multi-year lows below 1,38 last Dec is arguably the first evidence of a base/reversal-threat environment that, if correct, warns of what could be lateral-to-higher prices that span quarters or even years.
These issues considered, traders are advised to move to a new bullish policy and first approach setback attempts to 1.414 OB as corrective buying opportunities with a close below 1.393 required to negate this call. IN lieu of such sub-1.393 weakness we anticipate lateral-to-higher prices that could span weeks or event months.
