Posted on Feb 01, 2024, 07:24 by Dave Toth
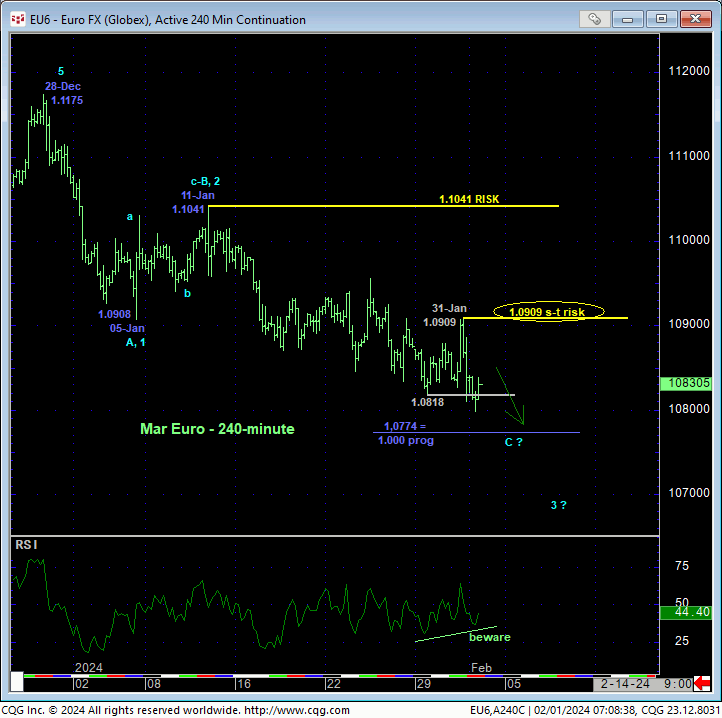
Yesterday’s break below Mon’s 1.0818 reaffirms and reinstates what we believe is a larger-degree correction down from 28-Dec’s 1.1175 high introduced in 02-Jan’s Technical Webcast and leaves yesterday’s 1.0909 high in its wake as the latest smaller-degree corrective high this market is now minimally required to recoup to confirm a bullish divergence in short-term momentum and break even the portion of this month-long decline from 11-Jan’s 1.1041 larger-degree corrective high, let alone threaten the entire decline from 1.1175. Per such, we’re identifying 1.0909 as our new short-term parameter from which shorter-term traders can objectively rebase and manage the risk of a still-advised bearish policy and exposure.

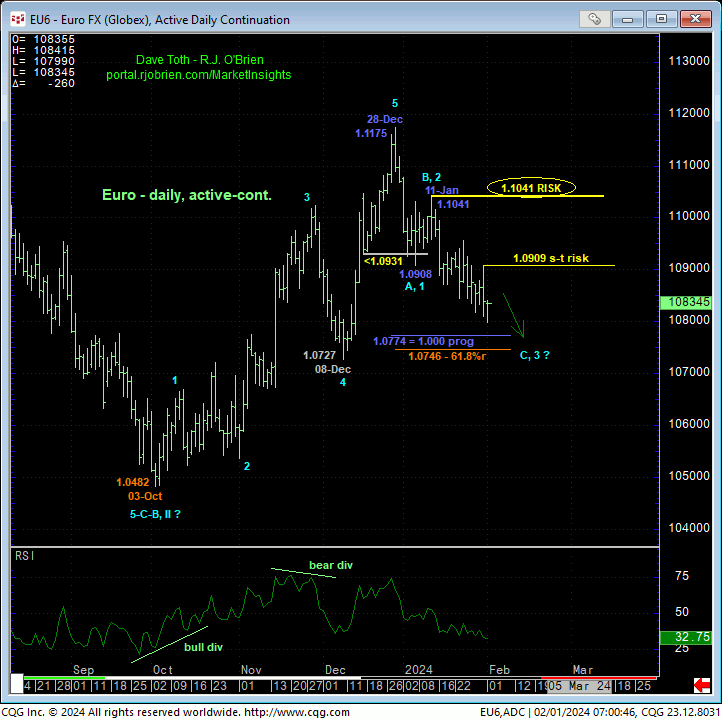
In both the 240-min chart above and daily chart below, we’ve noted the 1.0774-area as the 1.000 progression of late-Dec/early-Jan’s initial (prospective a-Wave) 1.1175 – 1.0908 decline from 11-Jan’s 1.1041 high that is just spittin’ distance from the (1.0746) 61.8% retrace of Oct-Dec’s entire 1.0482 – 1.1175 rally. This pair of Fibonacci progression and retracements relationships defines that 1.0774-to-1.0746-area as one of “interest” around which to beware a relapse-stemming bullish divergence in momentum. These merely derived levels are NOT considered support. BUT IF this area is accompanied by a confirmed bullish divergence in momentum needed to, in fact, break the clear and present and simple downtrend pattern of lower lows and lower highs, then a preferred and favorable risk/reward opportunity may exist from the bull side. Until/unless such a mo failure arrests the downtrend, further and possibly accelerated losses remain expected, possibly blowing away this Fibonacci area of “interest”.
On a longer-term basis, commensurately larger-degree strength above 11-Jan’s 1.1041 larger-degree corrective high remains required to COFIRM the decline from 28-Dec’s 1.1175 high as a 3-wave and thus corrective affair that we’d then look to re-expose what may be a resumption of the very long-term uptrend that dates from Sep’22’s 0.9592 low. Per such, that 1.1041 high remains intact as our key long-term bear risk parameter pertinent to longer-term institutional players.

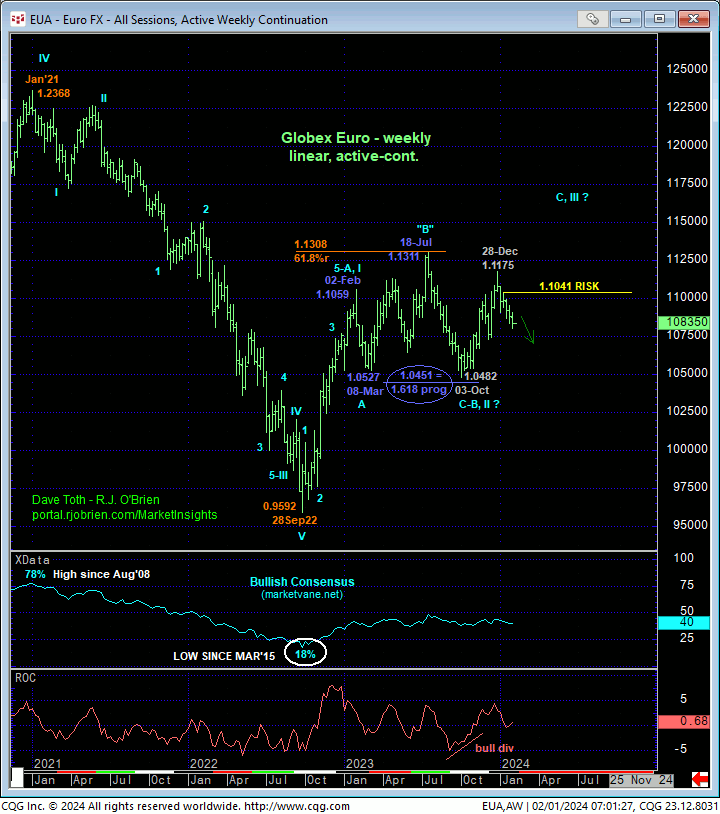
Lastly, the weekly chart below shows the market’s current position deep within the middle-half bowels of the past YEAR’S lateral range between 1.13 and 1.05 where the odds of ai less whipsaw risk and volatility should be approached as higher, warranting a more conservative approach to directional risk assumption that highlights tighter but objective risk parameters like 1.1041 and even 1.0909. Until the market recoups at least yesterday’s 1.0909 high, the intermediate-to-longer-term trend remains down and should not surprise by its continuance or acceleration straight away.
These issues considered, a bearish policy and exposure remain advised with a recovery above 1.0909 required for shorter-term traders to neutralize exposure and for even longer-term institutional players to pare bearish exposure to more conservative levels. In lieu of such strength, further and possible accelerated losses remain expected.


