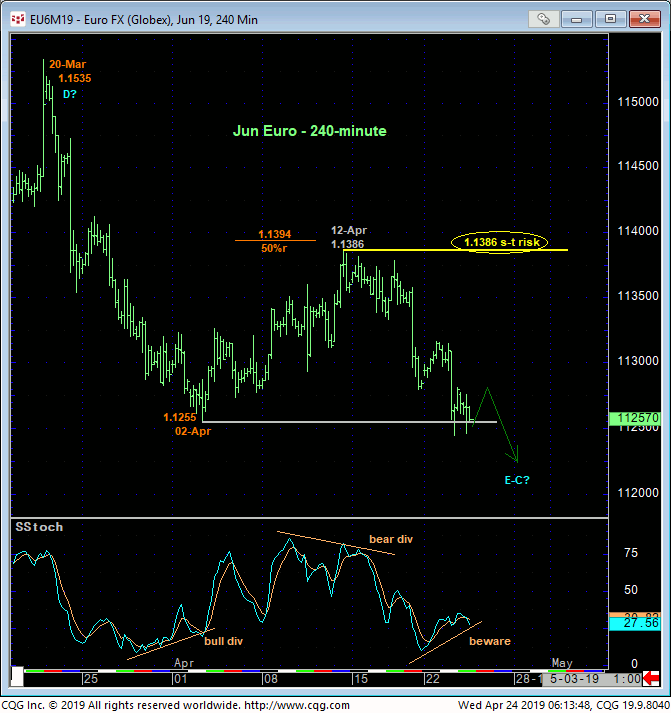
At its simplest technical assessment, yesterday and today’s relapse below 02-Apr’s 1.1255 low confirms the early-Apr recovery attempt as a correction that leaves 12-Apr’s 1.1386 high in its wake as the latest smaller-degree corrective high this market is now required to recoup to negate a more immediate bearish count. In this regard that 1.1386 high becomes our new short-term risk parameter from which all non-bullish decisions like long-covers and cautious bearish punts can now be objectively based and managed by shorter-term traders with tighter risk profiles.
As we step back to longer-term perspective, the technical picture clouds up and is more challenging given the past 10 months’ 2-steps-down-1-step-up “falling-wedge” price action we’ll try to dissect below. But against this backdrop, 12-Ar’s simple and objective 1.1386 high and short-term risk parameter may play a pivotal role.
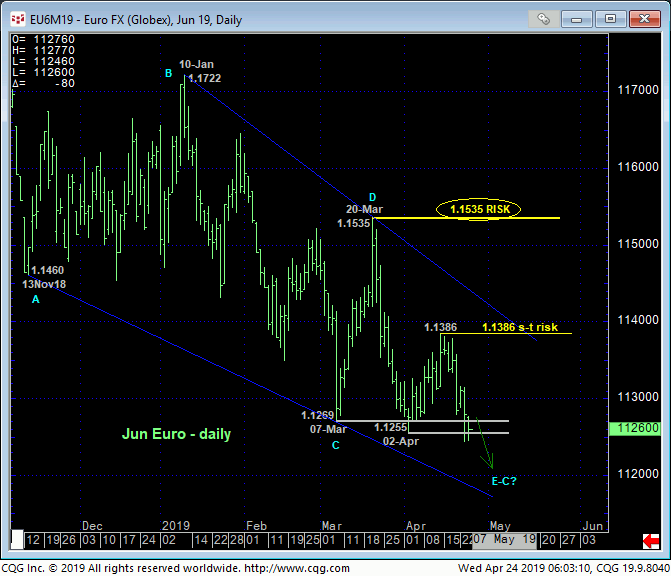
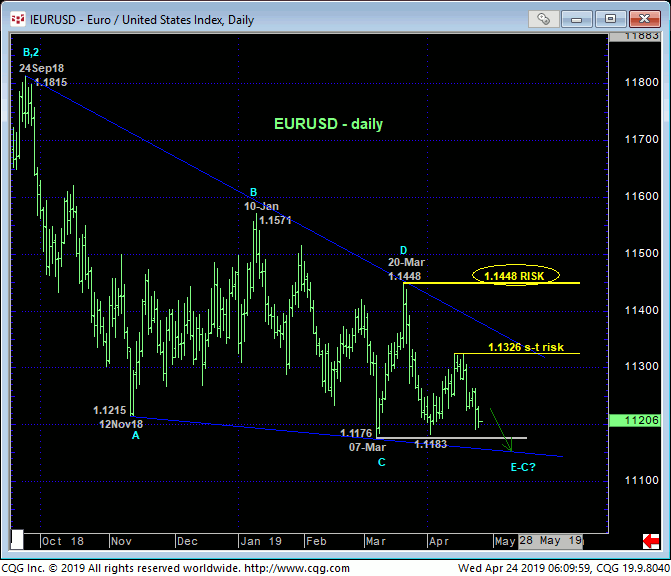
Both the daily chart of the Jun contract above and the cash market below show the very challenging “falling-wedge” price action that dates from at least last Nov and arguable since last Jun (noticeable on a weekly basis further below). The Jun contract has broken to new lows but the cash market remains above the past couple months’ 1.1183-to-1.1176-area support. Given the magnitude of the 14 months of downtrend above it, we suspect a break to new lows in the cash below 1.1176. Regardless however, 12-Apr’s 1.1326 high is THE minimum high and risk parameter the market needs to recoup to defer or threaten a bearish count needed to warrant non-bearish steps.
But given the falling-wedge nature of the past 10 months’ price action, it is far from certain what lies beneath 07-Mar’s 1.1176 low. The market could collapse in increasingly obvious meltdown fashion OR it could whipsaw the masses again as it has done for months. And herein lies the importance of 12-Apr’s simple corrective high and short-term risk parameter at 1.1326 in the cash and 1.1386 in the Jun contract.
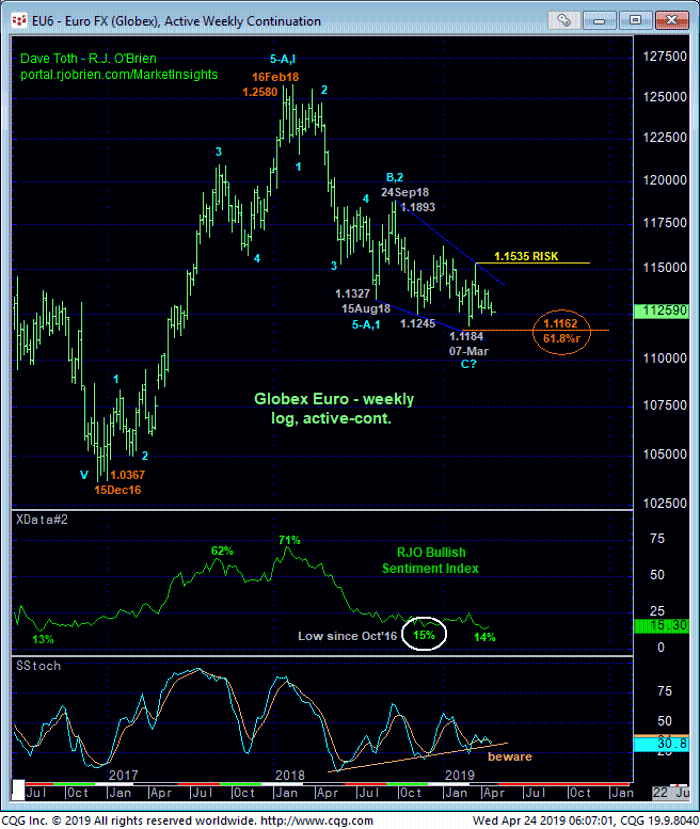
How the bear behaves “down here” and relative to 12-Apr’s corrective high is particularly important given three key longer-term factors:
- downside momentum that’s been waning for months, posing a huge bullish divergence threat
- historically bearish sentiment levels
- the market’s continued proximity to and flirtation with the 61.8% retrace of Dec’16 – Feb’18’s rally.
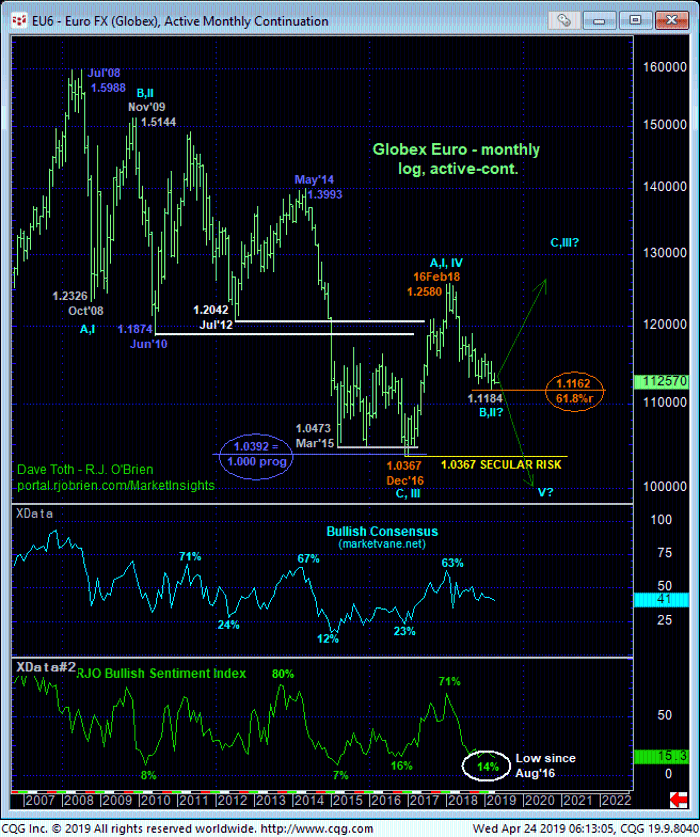
On a weekly log active-continuation basis of the contract above, the bear has yet to break 07-Mar’s 1.1184 low Whether the bear resumes or not is almost a moot point at this juncture as PROOF of some semblance of uptrend is now required above 12-Apr’s simple 1.1386 high. Until and unless the market recoups this high, traders are urged not to underestimate the market’s downside potential. For it has been our observation over many years that such falling-wedge structures warn of one of two things:
- waning momentum ahead of a reversal or
- a sort of “coiling-up” before the trend goes ballistic in a very obvious, relentless way.
Under these circumstances we approach the market’s downside potential as indeterminable and potentially severe. But we also know with specificity where the market should NOT trade per any such broader bearish count: above 1.1386 on a short-term basis and certainly not above 20-Mar’s 1.1535 next larger-degree corrective high and key long-term risk parameter.
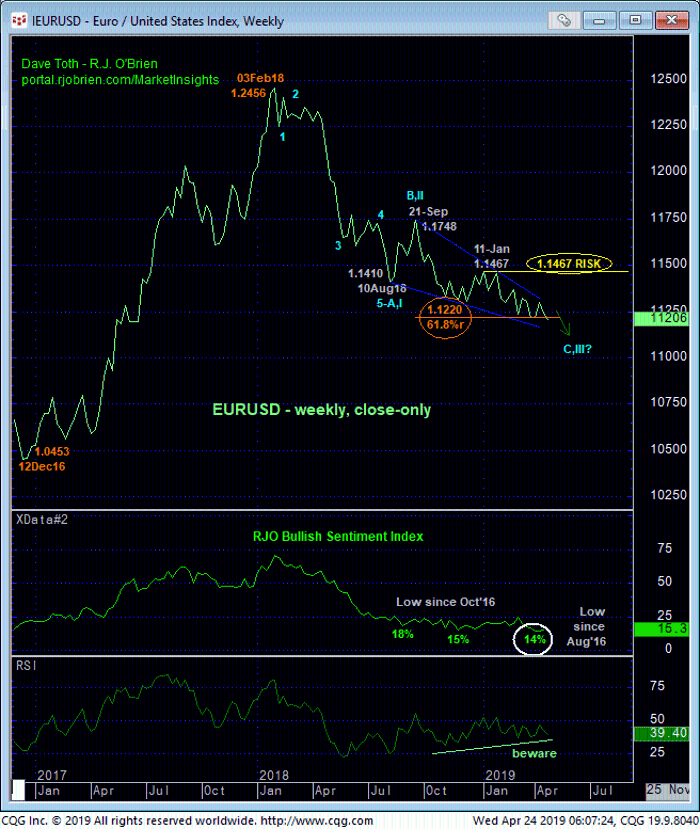
Finally and from a very long-term monthly log scale perspective that adds even more intrigue to the equation, we maintain that the extent and impulsiveness of the Dec’16 – Feb’18 rally BROKE the secular downtrend and was just the initial (A- or 1st-Wave) of a major correction or reversal higher. If correct, this count further states that the past 14-month relapse is a (B- or 2nd-Wave) correction within a multi-year BASE/reversal environment and a unique, long-term favorable risk/reward buying opportunity ahead of a resumption of 2017’s rally to eventual new highs above 1.26! IF IF IF this is the case, then we’d expect the market to start providing the downtrend-stemming price action from approximately current levels.
If, alternatively, were 10% wrong on this major base/reversal count and 2017’s rally was just a correction in the secular bear trend, then somewhere along the lines the 11-year secular bear market needs to start behaving like one with increasingly obvious meltdown behavior. The market’s failure to sustain recent losses below 12-Apr’s 1.1386 simple corrective high and short-term risk parameter would NOT be indicative of such a bearish count. And while we would not be able to conclude a major reversal from such smaller-degree proof of strength above 1.1326, such strength would tilt the directional scales bac to the bull side and reject/define another low and support from which any non-bearish decisions like short-covers and cautious bullish punts would then be able to be objectively based and managed.
These issues considered, long-term players remain advised to maintain a bearish policy with strength above 1.1386 required to pare this exposure to more conservative levels and commensurately larger-degree strength above 1.1535 required to negate a bearish count altogether and warrant complete coverage of remaining bearish exposure. Shorter-term traders whipsawed out of bearish exposure following 03-Apr’s bullish divergence in momentum are advised to move bac to a cautious bearish policy from 1.1275 OB with a recovery above 1.1386 negating this call and warranting its cover. In lieu of such 1.1386+ strength, further and possibly accelerated losses should not surprise.
