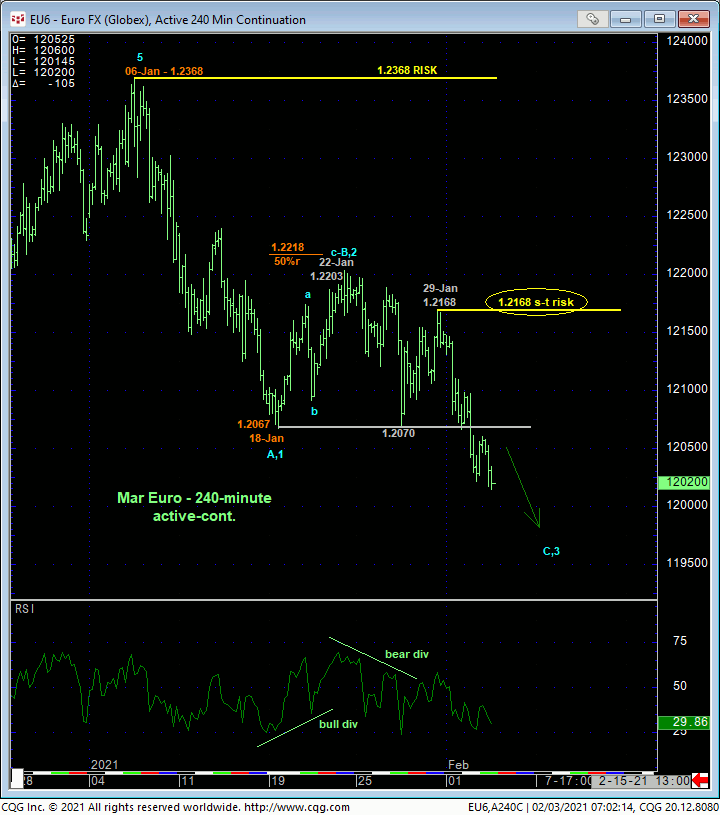
MAR EURO
This week’s clear break below the past couple weeks’ lows and support around 1.2070 reaffirms our peak/correction/reversal count introduced in 11-Jan’s Technical Webcast and leaves Fri’s 1.2168 high in its wake as the latest smaller-degree corrective high this market is now required to recover above to arrest the clear and present and developing downtrend that we believe could have protracted, if intra-four-year-range losses ahead. Per such, this 1.2168 level serves as our new short-term risk parameter from which shorter-term traders with tighter risk profiles can objectively rebase and manage the risk of a still-advised bearish policy and exposure.
Former uper-1.20-handle-area support is considered new near-term resistance.
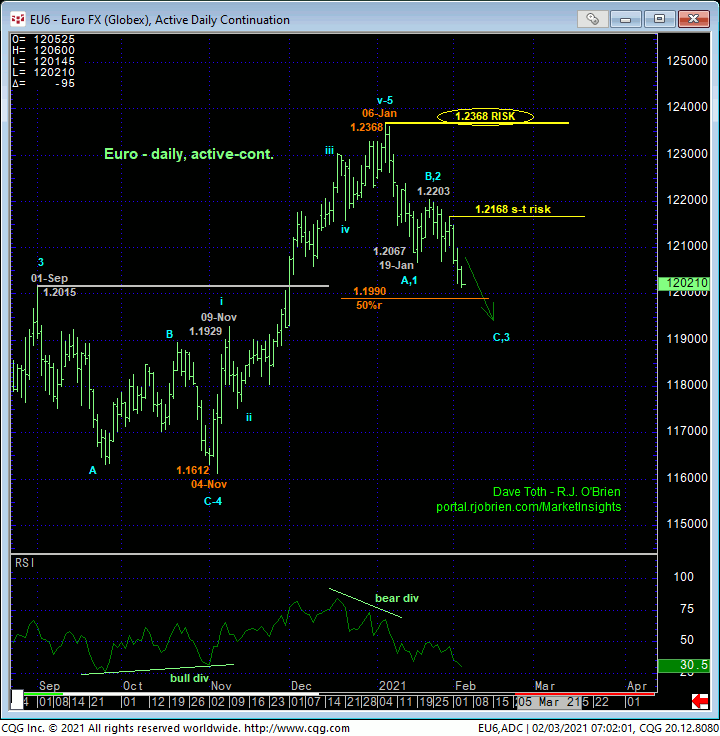
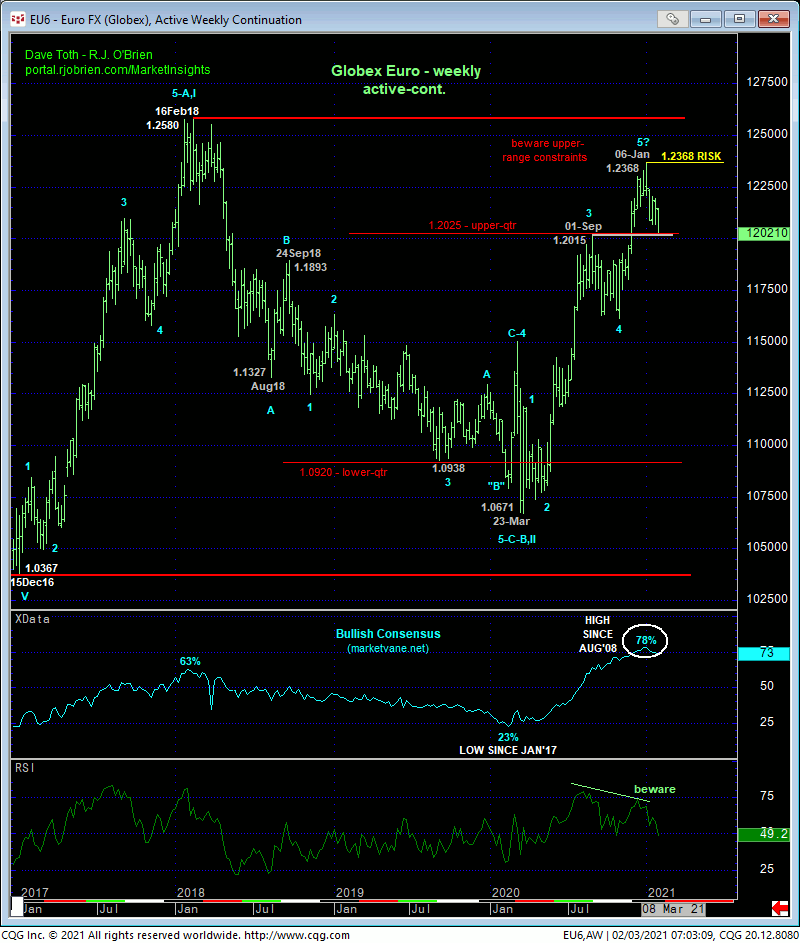
On a broader scale, the daily chart above and weekly chart below show the compelling and unique list of technical elements that contribute to our peak/reversal count:
- 11-Jan’s bearish divergence in daily momentum that
- defined 05-Jan’s 1.2368 high as the END of a textbook 5-wave Elliott sequence up from 04-Nov’s 1.1612 low that arguably completed a
- major 5-wave Elliott sequence from 23Mar20’s 1.0671 low as labeled below amidst
- waning upside momentum on a WEEKLY basis amidst
- historically frothy levels in the Bullish Consensus (marketvane.net) not seen since 2008! and
- the market’s proximity to the upper-quarter resistance of its massive four-year lateral range.
This is a whopping amount of technical evidence against the bull that, if correct, we believe exposes a major correction of Mar’20 – Jan’21’s entire 1.0671 – 1.2368 rally that could easily produce a multi-month correction to the 1.17-to-1.15-area or lower. Admittedly, the formerly resistant 1.19-handle-area from early-Aug until mid-Nov now serves as a new support candidate. But until even deferred by a recovery above 1.2168, the trend s down on most practical scales and should not surprise by its continuance or acceleration straight away. A confirmed bulish divergence in shorter-term momentum from the 1.19-handle-area is required to even defer, let alone threaten this bearish count.
In sum, a bearish policy and exposure remain advised with a recovery above 1.2168 required for shorter-term traders to step aside and commensurately larger-degree strength above 1.2368 fr long-term institutional players to follow suit. In lieu of such strength, further and possibly accelerated losses straight away should not surprise.
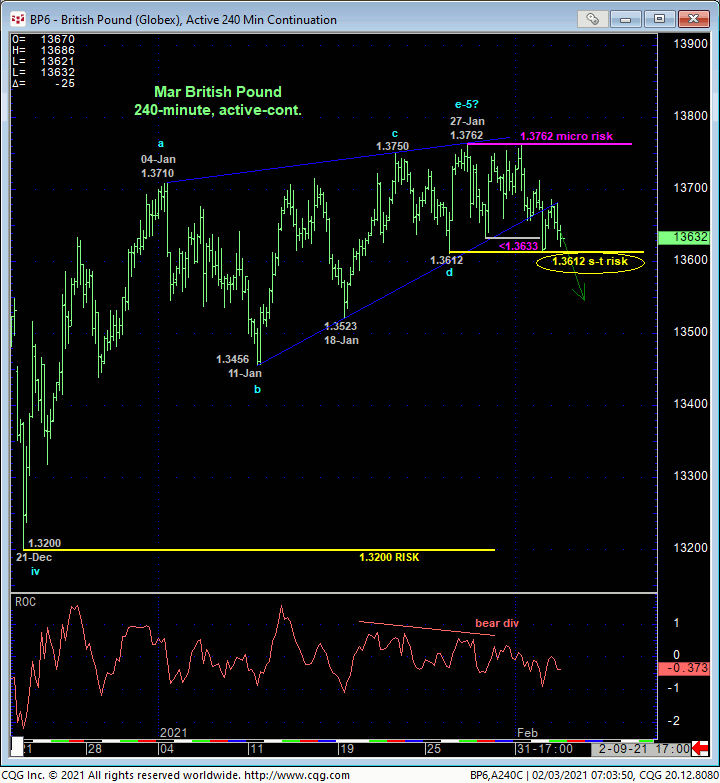
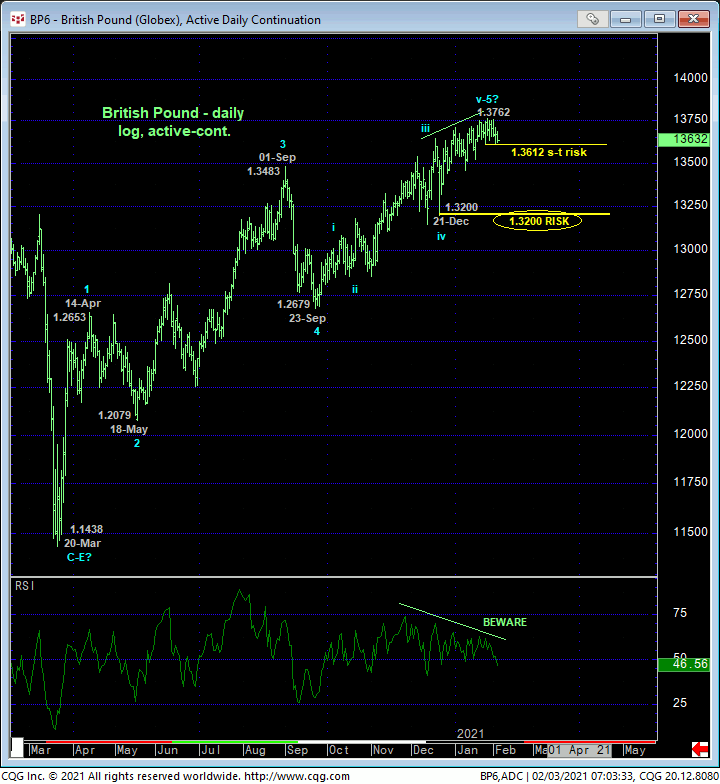
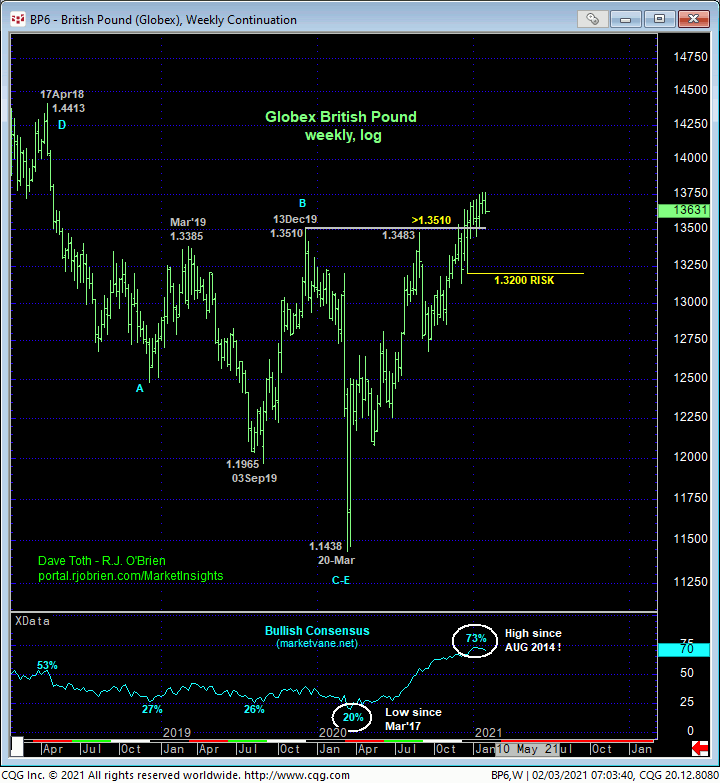
On a daily basis above, upside momentum has been dying on the vine for well over a month, but commensurately larger-degree weakness below 21-Dec’s 1.3200 next larger-degree corrective low and key risk parameter remains required to confirm this daily divergence and conclude the end of a 5-wave sequence from at least 23-Sep’s 1.2679 low and possibly from 20Mar20’s 1.1438 low. The sentiment/contrary opinion fact that the Bullish Consensus has recently reached its highest level (73%) since Aug 2014 would seem t reinforce this peak/correction/reversal-threat environment.
These issues considered, shorter-term traders are advised to neutralize bullish exposure and move to a new bearish policy and exposure on the immediate break below 1.3612 with a subsequent recovery above 1.3762 to negate this specific call and warrant its cover. Longer-term institutional players are advised to pare bullish exposure to more conservative levels on a failure below 1.3612 and jettison remaining exposure on a failure below 1.3200 ahead of what we’d expect at that time t be a major correction lower that could span months and see the market setback to the 1.28-to-1.25-range.
