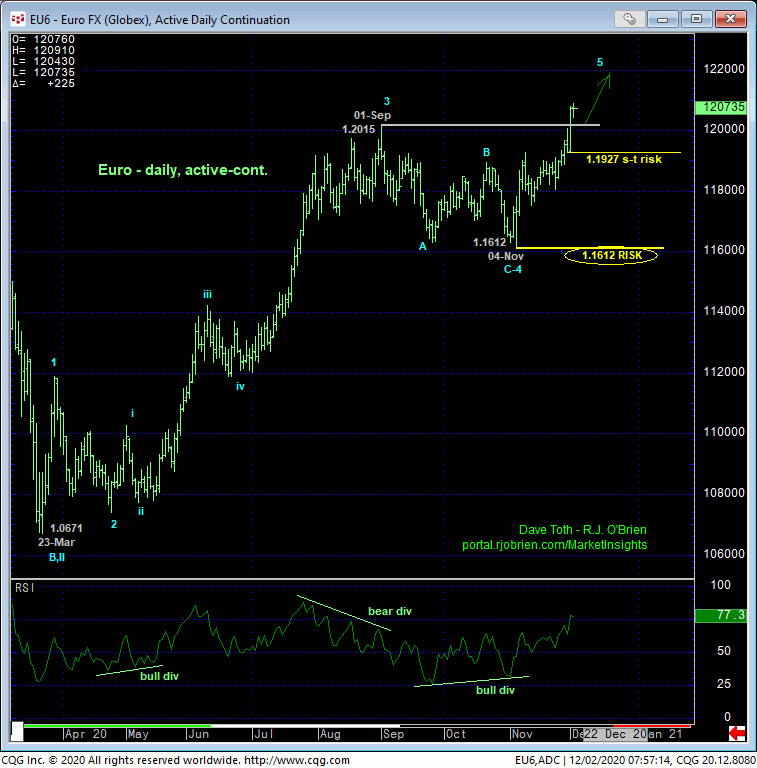
Yesterday’s clear, impulsive break above 01-Sep’s 1.2015 high confirms Sep-Nov’s sell-off attempt as a 3-wave and thus (4th-Wave) correction and the resumed rally from that point as, we believe, the likely 5th-Wave of this year’s major reversal from 23-Mar’s 1.0671 low. As recently discussed, 04-Nov’s 1.1612 larger-degree corrective low serves as the key long-term risk parameter this market is required to fail below to break this year’s major uptrend and expose another intra-four-year-range relapse that could be extensive. Until such weakness is proven, the major trend is up and should not surprise by its continuance or acceleration with former 1.1925-to-1.2000-area resistance expected to hold as new near-term support.

This said, traders also must acknowledge threats to the bull that include:
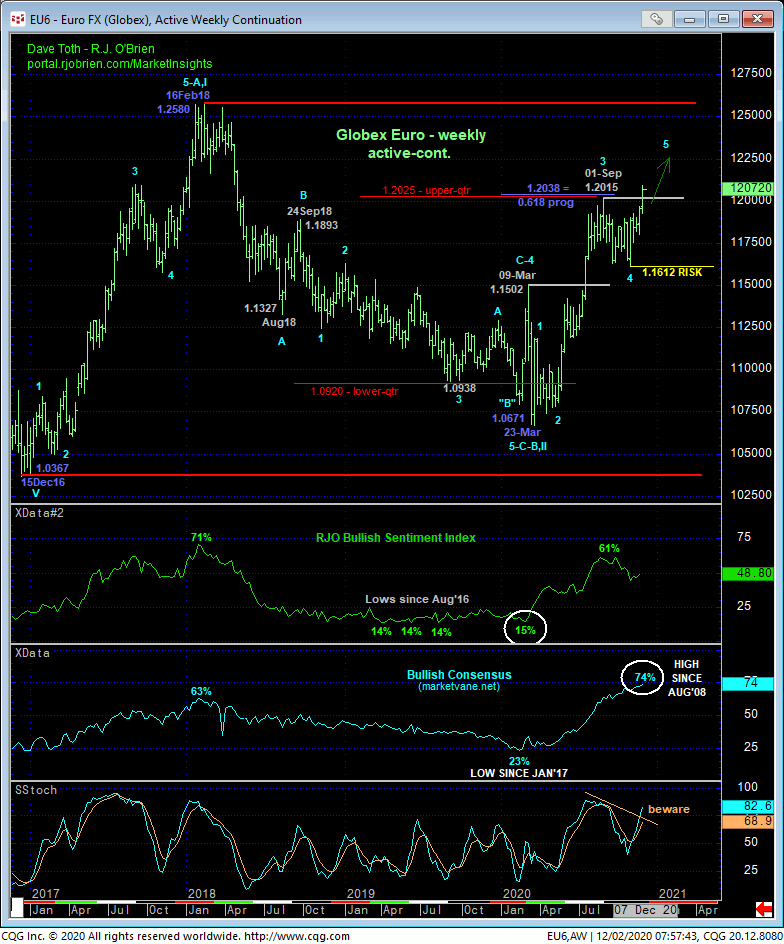
- The market’s foray into the upper-quarter of the massive FOUR-YEAR lateral range sown in the weekly chart below amidst
- The highest level (74%) in the Bullish Consensus (marketvane.net) measure of market sentiment since Aug 2008
- Waning upside momentum on a weekly basis and
- The prospect that the rally from 04-Nov’s 1.1612 low is the completing 5th-Wave of a major Elliott sequence up from Mar’s 1.0671 low.

Now, none of these so-called threats to the bull matter one iota until and unless the market, quite simply, fails to sustain the uptrend; or, as Elliott geeks put it, fails to maintain its impulsive integrity. We’ve identified 04-Nov’s 1.1612 larger-degree corrective low as an obvious and major corrective low and risk parameter.
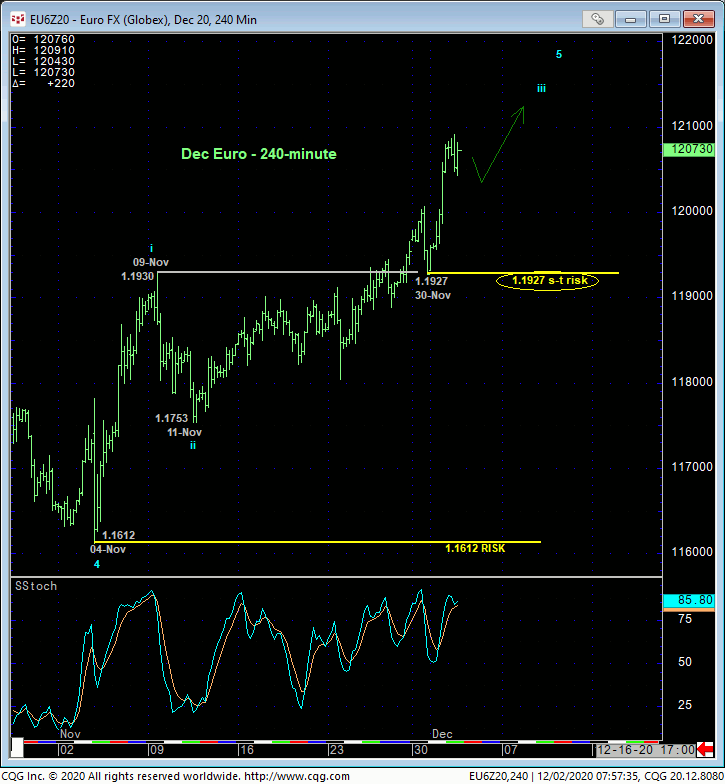
Trying to zero in on tighter, more practical risk parameters however, the 240-min chart below shows yesterday’s accelerated, impulsive spike leaving Mon’s 1.1927 low in its wake as the latest smaller-degree corrective low. A failure below 1.1927 may not be the death knell of this year’s major uptrend, but given the peak/reversal-threat factors listed above, it’d certainly start to question the risk/reward merits of bullish exposure “up here”, warranting a move to the sidelines by shorter-term traders and pared bullish exposure by longer-term players. In lieu of weakness below at least 1.1927 however, the trend is up on all practical scales and should not surprise by its continuance or acceleration.
These issues considered, we will be watchful for proof of 3-wave corrective behavior on a setback attempt to the upper-1.19-handle that, if stemmed by a bullish divergence in short-term mo, would reinforce a bullish count and define a tighter, more conservative risk parameter from which to cautiously approach this market from the bull side. In the meantime, a neutral/sideline policy remains advised. For those who fear this market running away to the upside and wanting to chase prices around the upper-1.20-handle-area, the risk parameter of doing so is 1.1927.


