Today’s impulsive poke above the past month’s worth of resistance reinforces our broader base/reversal count and leaves yesterday’s 1.1730 low in its wake in the now-prompt Dec contract as the latest smaller-degree corrective low this market is now minimally required to fail below to threaten this call. In this regard that 1.1730 level is considered our new short-term risk parameter from which the risk of a still-advised bullish policy and exposure can be objectively rebased and managed by shorter-term traders with tighter risk profiles. Former 1.1830-to-1.1805-area resistance is considered new near-term support ahead of further and possibly accelerated gains straight away.
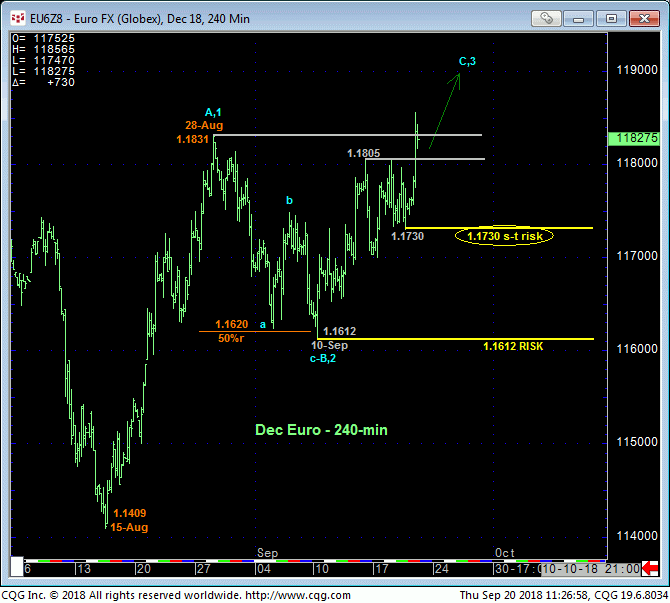
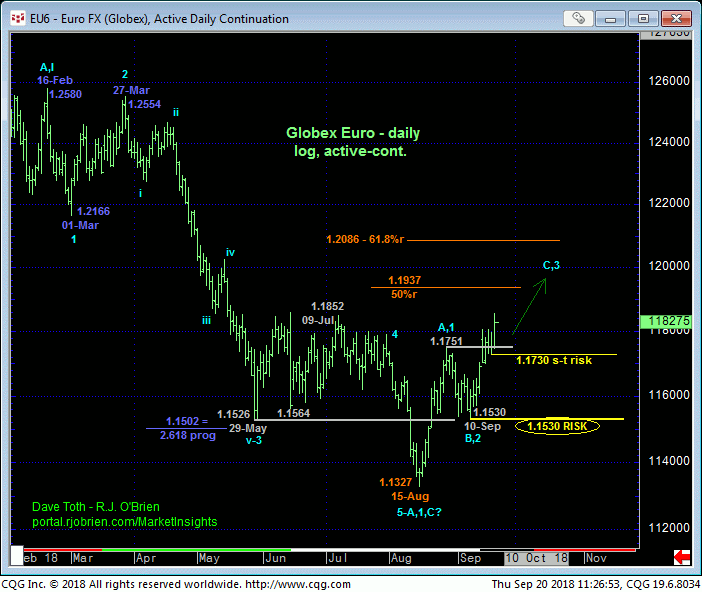
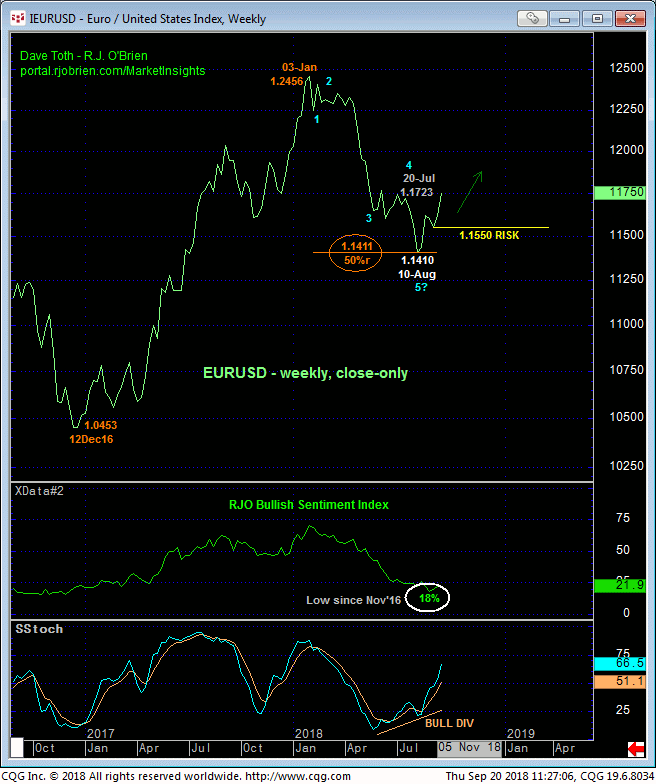
From a longer-term perspective this week’s break above 28-Aug’s 1.1831 high in the Dec contract verifies the past week’s break above 28-Aug’s 1.1751 high in the then-prompt Sep contract that confirms our broader base/reversal count introduced first in 21-Aug’s Technical Blog. This bullish count is predicated on:
- a confirmed bullish divergence in momentum that defines 15-Aug’s 1.1327 low as the
- end of a textbook 5-wave Elliott sequence down from 16-Feb’s 1.2580 high amidst
- the lowest reading in our RJO Bullish Sentiment Index (below) since Nov’16 that warned of and accompanied THE MAJOR Dec’16 low and reversal and
- the cash Euro’s rejection of the exact (1.1411) 50% retrace of Dec’16 – Jan’18’s entire 1.0453 – 1.2456 rally on a weekly close-only basis below.
On a broader scale 10-Sep’s 1.1530 next larger-degree corrective low now serves as our key long-term risk parameter the market needs to fail below to not only break the broader developing uptrend, but render the recovery from 1.1327 a 3-wave and thus corrective affair that would warn of a resumption of this year’s major downtrend that preceded it.
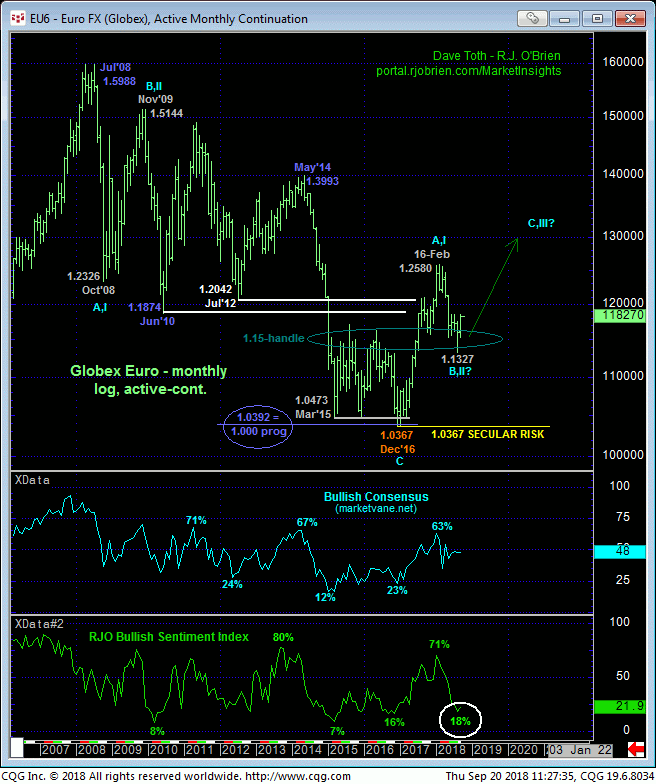
Finally and from an even longer-term perspective shown in the monthly log scale chart below, traders are reminded that the extent and (5-wave) impulsiveness of Dec’16 – Feb’18’s 1.0367 – 1.2580 rally arguably breaks the secular bear trend from Jul’08’s 1.5988 high. Additionally, 1.15-handle resistance from Feb’15 until Jul’17’s bust-out above it has thus far done its job of holding as new support on this year’s sell-off attempt. Considering the bullet points above, we cannot ignore the very bullish prospect that 15-Aug’s 1.1327 low COMPLETED a “mere (B- or 2nd-Wave) correction” within a multi-year base/reversal PROCESS that, if correct, warns of a resumption of 2017’s (A- or 1st-Wave) rally to eventual new highs above 1.2580!
Think about this for a second….a prospective (and what would be a trendy, directional) move from current 1.1885-area prices to new highs above 1.2580 without the market relapsing below 1.1530 and possibly even 1.1730. Of course, any such really long-term forecasts cannot be concluded following proof of relatively minor strength. But what the past few weeks’ price action HAS done, and with specificity, is identify two risk parameters at 1.1730 and 1.1530 from which a bullish policy (to wherever the bull’s going) can be very objectively based and managed.
These issues considered, a bullish policy and exposure remain advised with a failure below 1.1730 for shorter-term traders to move to the sidelines and longer-term players to pare bullish exposure to more conservative levels. In lieu of such weakness further and possibly accelerated, even shocking gains are anticipated straight away.
DEC BRITISH POUND
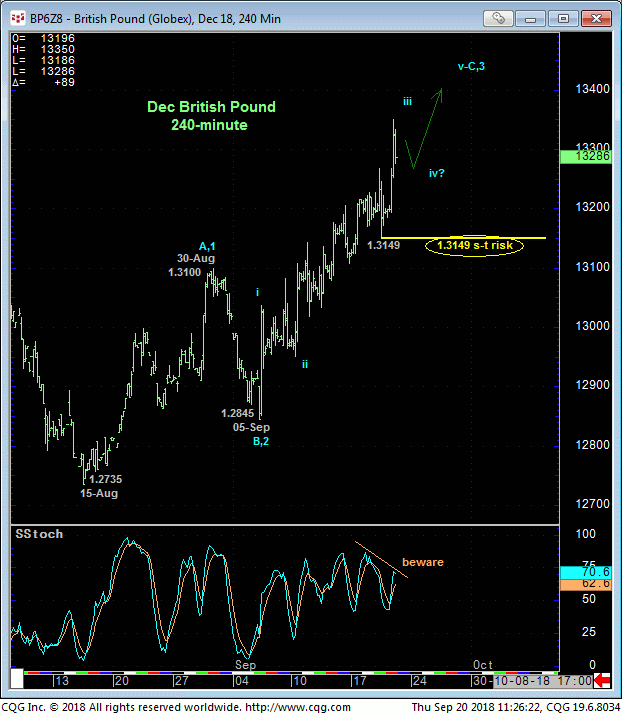
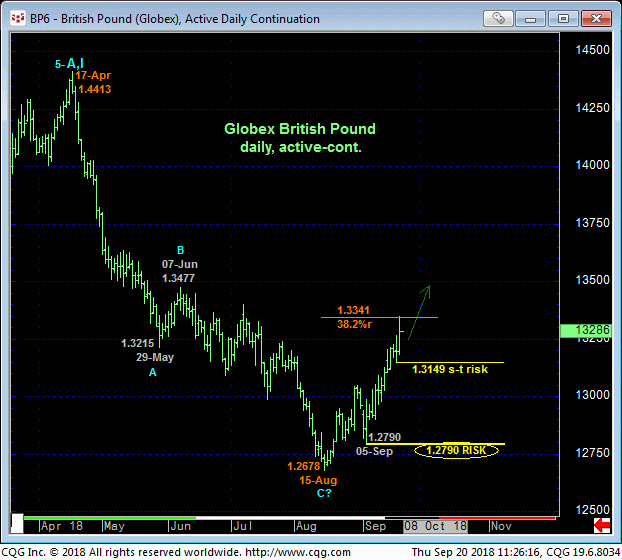
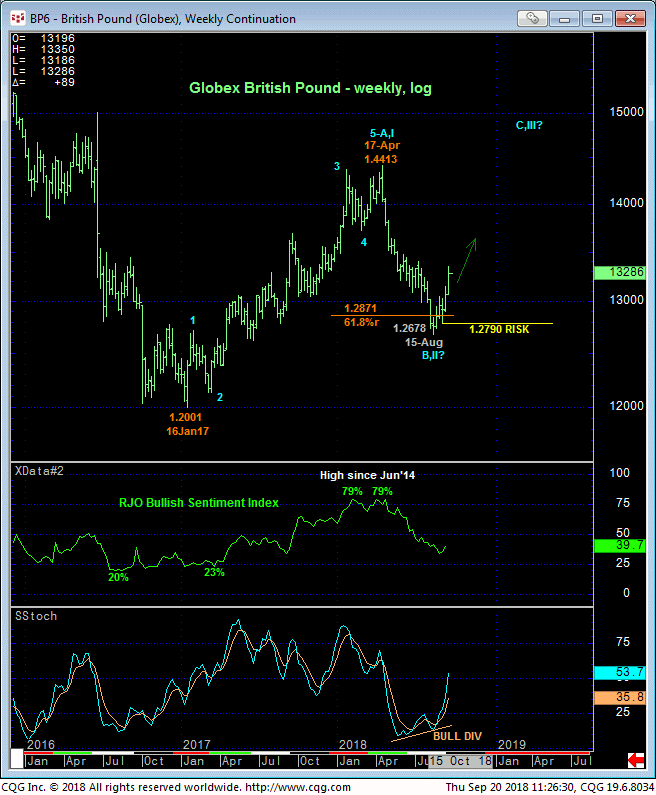
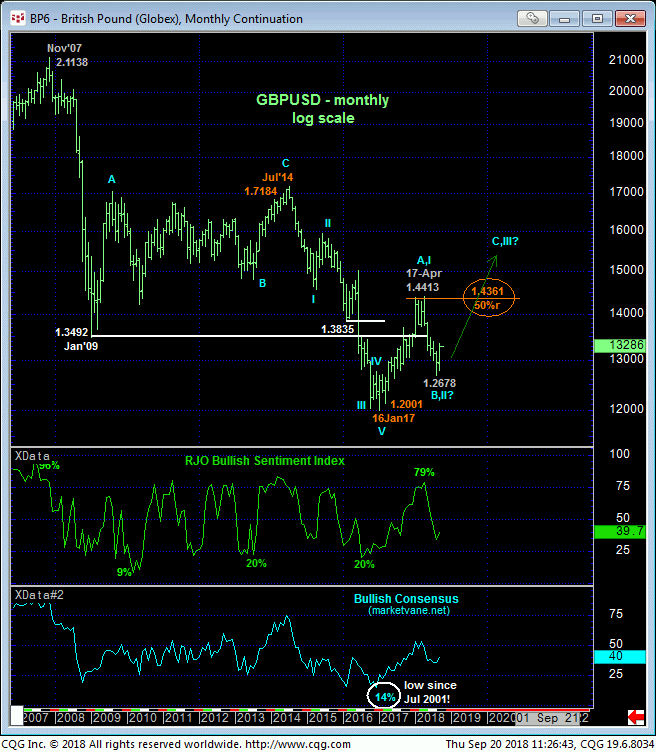
The technical construct and expectations for sterling are virtually identical to those detailed above in the Euro with smaller- and larger-degree corrective lows at 1.3149 and 1.2790 considered our new short- and longer-term risk parameters to a still-advised bullish policy and exposure. In lieu of such weakness, further and possibly accelerated gains should not surprise in a move that could span weeks or even months.
