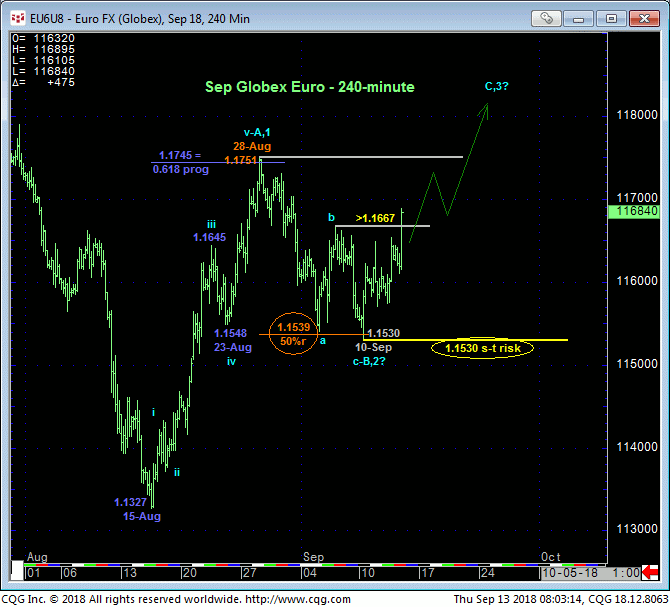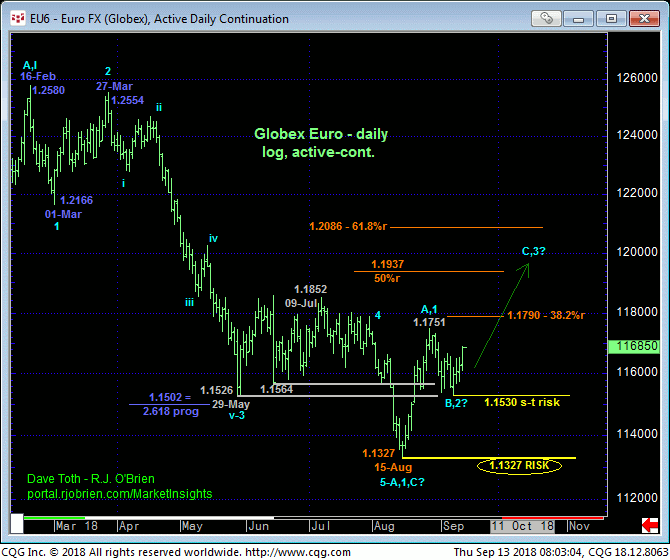
In 31-Aug’s Technical Blog we discussed waiting for an expected (B- or 2nd-Wave) corrective rebuttal to Aug’s 1.1327 – 1.1751 rally from a preferred risk/reward buying opportunity in what we believe is a compelling and opportunistic base/reversal process that could have extraordinary upside potential. This morning’s nondescript recovery above 06-Sep’s 1.1667 high (just like yesterday afternoon’s nondescript recovery above 1212.7 in Dec gold discussed in today’s Gold Tech Blog) renders the sell-off attempt from 28-Aug’s 1.1751 high a 3-wave structure as labeled in the 240-min chart below.
Left unaltered by a relapse below Mon’s 1.1530 low, this 3-wave setback is considered a corrective/consolidative affair that warns of a resumption of Aug’s 1.1327 – 1.1751 rally that preceded it. The Fibonacci fact that this setback came within nine pips of the (1.1539) 50%v retrace of Aug’s 1.1327 – 1.1751 rally would seem to reinforce this bullish count. Per such, traders are advised to consider Mon’s 1.1530 low as our new short-term risk parameter from which a bullish policy and exposure can now be objectively based and managed.


Our longer-term base/reversal count introduce in 21-Aug’s Technical Blog is predicated on:
- a textbook 5-wave Elliott sequence down from 16-Feb’s 1.2580 as labeled in the daily chart above
- the market’s gross failure to sustain mid-Aug’s break below nearly THREE MONTHS of former support that then should have held as new resistance if the market was still truly weak “down there”
- trendy, impulsive behavior in late-Aug’s initial counter-trend rally
- corrective behavior in early-Sep’s relapse attempt
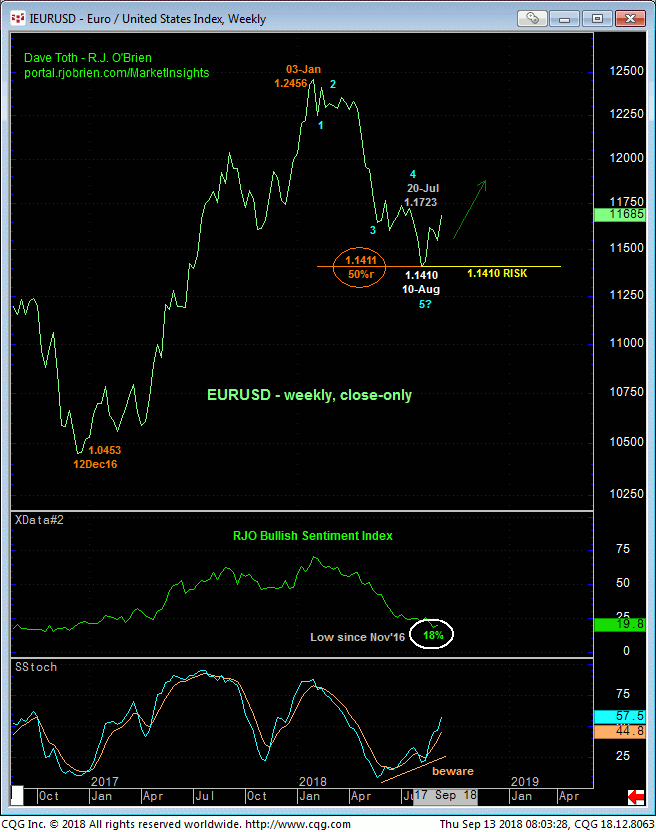
- historically bearish levels in our proprietary RJO Bullish Sentiment Index and
- the market’s exact 50% retrace of Dec’16 – Jan’18’s entire 1.0453 – 1.2456 rally on a weekly close-only basis of the underlying cash market below amidst
- waning downside momentum on a long-term weekly basis.

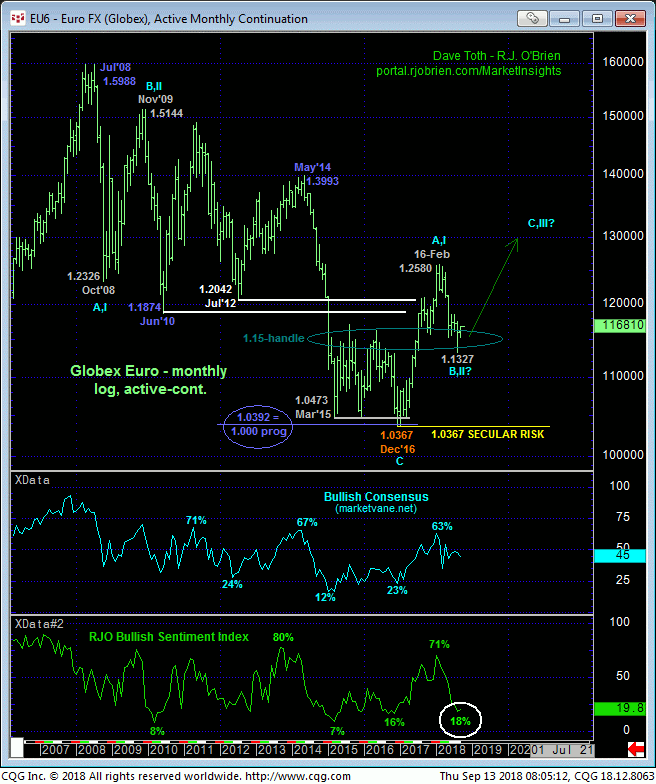
Finally and from an even longer-term monthly log scale perspective below, the extent and impulsiveness of 2017’s rally above former and HUGE 1.19/1.20-area support-turned-resistance arguably breaks the secular bear trend from Jul 2008’s 1.5988 high. While Dec’16’s 1.0367 low remains intact, so too does a massive base/correction/reversal count that contends Dec’16 – Feb’18’s rally is just the (A- or 1st-Wave) START to a major correction or reversal higher to ultimately levels well above this year’s 1.2580 high. Per this count this year’s Feb-Aug setback attempt would be considered part or all of a correction ahead of a resumption of 2017’s uptrend to new highs above 1.2580.
Herein lies the compelling and opportunistic nature of the past few weeks’ and even the past couple days’ price action that identifies corrective lows at 1.1530 and 1.1327 from which a bullish policy and exposure can be objectively based and managed. Of course, we cannot conclude a major move higher from such smaller-degree price action. What we DO know however is exactly where the market needs to trade to threaten and then negate any broader bullish count: below 1.1530 and 1.1327. Until and unless such weakness is shown, and especially if the market pokes above 28-Aug’s 1.1751 initial counter-trend high, we believe a cautious bullish policy and exposure from 1.1675 OB presents a favorable risk/reward opportunity with protective sell-stops below 1.1530.


