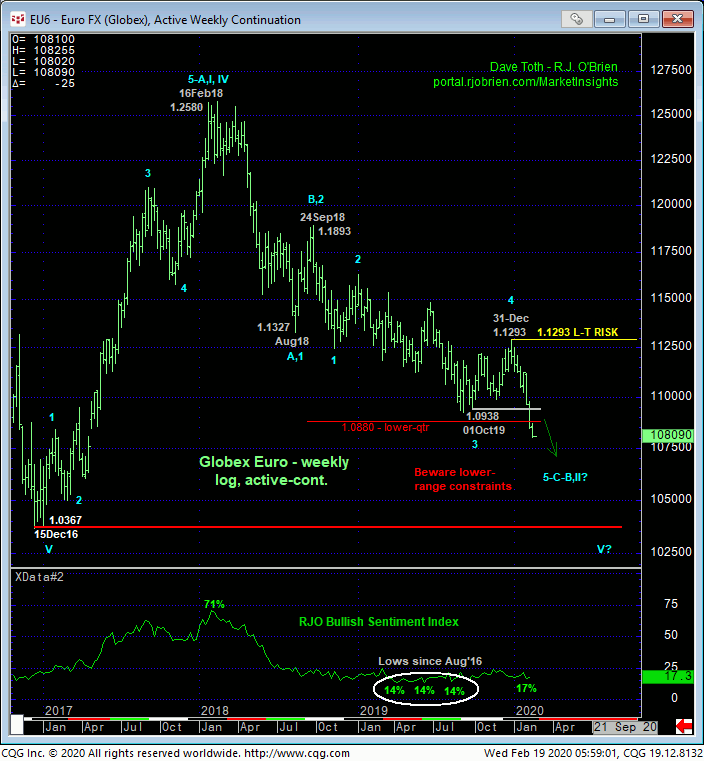
With the past week’s obliteration of last year’s lower-1.09-handle-area lows, the weekly log chart below shows that the market has exposed an area totally devoid of any technical levels of merit shy of Dec’16’s historic 1.0367 low. This doesn’t mean we’re forecasting a move to 1.03, but it certainly does mean that until and unless this market arrests the clear and present downtrend with a confirmed bullish divergence in momentum, the market’s downside potential is indeterminable and potentially severe, including a run at or through 1.03 to levels that haven’t been seen since the turn of the millennium.
Market sentiment levels are understandably historically low that, from the lower-quarter of the 3-year range, is certainly a factor typical of a broader BASE/reversal environment. But traders are reminded that sentiment/contrary opinion is not an applicable technical tool in the absence of an accompanying confirmed bullish divergence in momentum. And this, quite simply, requires proof of strength above a prior corrective high of a scale sufficient to threaten the major downtrend.
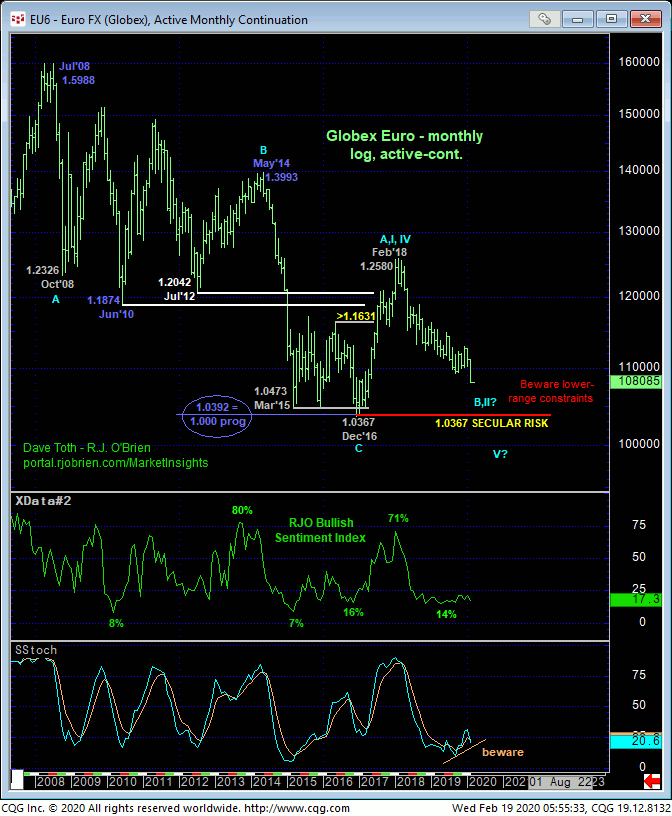
Moving out to a monthly scale below, the extent and impulsiveness of Dec’16 – Feb’18’s rally maintains the ultimately bullish possibility that that rally was just the initial (A- or 1st-Wave) of a huge, multi-year base/reversal environment, suggesting further that the past couple years’ relapse s merely a (B- or 2nd-Wave) correction. If this is the case however, then somewhere between spot and Dec’16’s 1.0367 low the market needs to stem this major downtrend with a confirmed bullish divergence in momentum.
If the 2016-18 recovery is a (4th-Wave) correction within a secular bear market that dates from Jul’08’s 1.5988 high, then an impulsive, emotional, relentless (5th-Wave) meltdown to new lows below 1.0367 may unfold straight away. Since the trend is down on all practical scales, this bearish count is our preferred count until and unless threatened by a recovery above some specific levels we’ll discuss below.
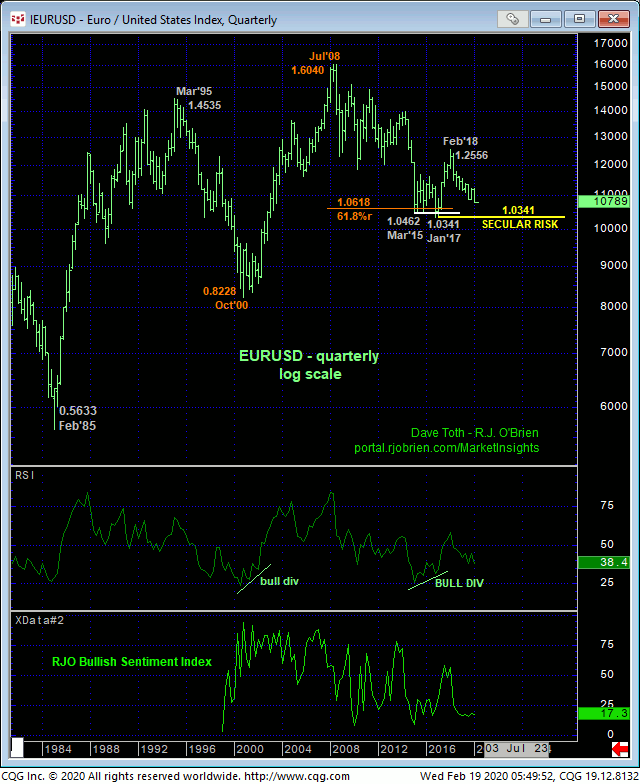
Before zeroing in on new bear risk levels, we’d like to present one more historical perspective in the quarterly log scale chart of the underlying cash market below. The obvious couple questions are 1) will this market break Jan’17’s 1.0341 low? and 2) if so, where can it drop to thereafter? The answer to #2 is easy: indeterminable and potentially severe. As for #1, it depends on whether this market can maintain trendy, impulsive behavior down in the months ahead and avoid any bullish divergences in momentum “down here” at the lower-quarter of the past 3-year range.
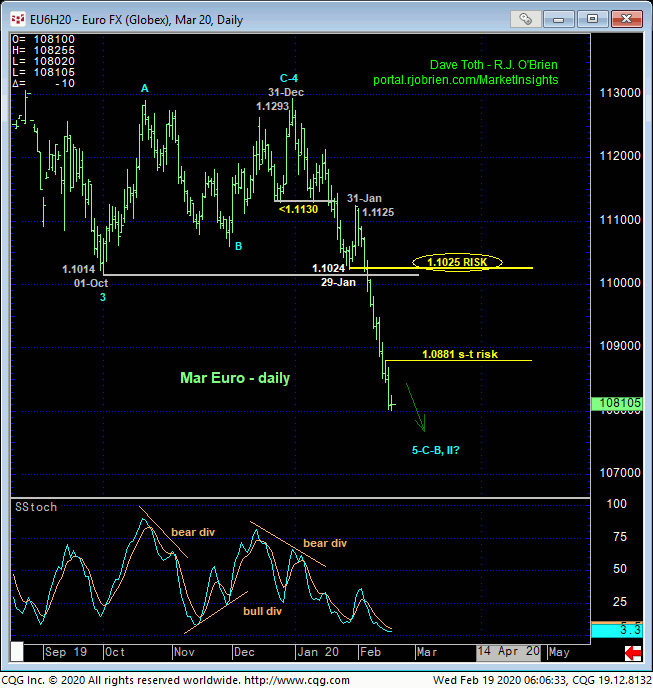
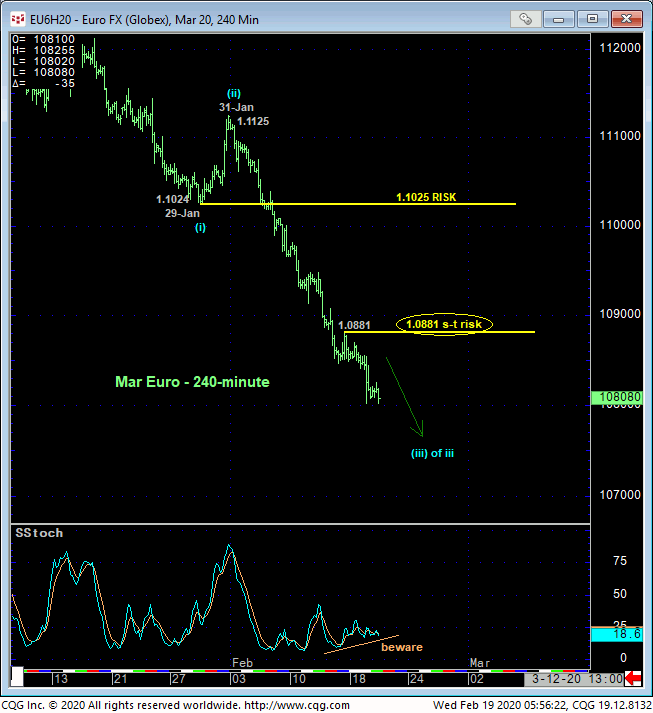
With our technical focus on momentum given the clarity of the clear and present downtrend, the extent and impulsiveness of Jan-Feb’s meltdown thus far strongly suggests further losses ahead as the trend looks to be ACCELERATING. Former lower-1.10-handle-area support is now considered a hugely important new resistance candidate and, for the time being, the area the market needs to recoup to jeopardize the impulsive integrity of a broader bearish count. Per such, we’re identifying 1.1025 as our new long-term risk parameter to a still-advised bearish policy for long-term institutional accounts. On this scale, minimally, we’d expect at least one decent-sized corrective recovery attempt and another round of new lows thereafter to even set up the POTENTIAL for a bullish divergence in momentum of a scale sufficient to threaten the major bear.
Needless to say, suggesting that this market is “oversold” and due for a rebound simply because any momentum indicator is “low” is ignorant of how momentum indicators are to be used and outside the bounds of prudent technical discipline.
From a very short-term perspective detailed in the 240-min chart below, the potential for a bullish divergence in momentum is developing, but a recovery above Fri’s 1.0881 smaller-degree corrective high is required to CONFIRM this divergence to the point of non-bearish action like short-covers by shorter-term traders with tighter risk profiles. And even if such 1.0881+ strength confirms a bullish divergence in mo, this would be of too minor a scale to conclude anything more than another interim corrective hiccup within the major bear.
These issues considered, a full and aggressive bearish policy and exposure remain advised with a recovery above 1.0881 required to confirm a bullish divergence in short-term momentum and warrant a move to the sideline by shorter-term traders to circumvent the heights unknown of what very likely will be just another interim corrective hiccup. A bearish policy and exposure remain advised for long-term players with commensurately larger-degree strength above 1.1025 minimally required to move to the sidelines. In lieu of such strength, further and possibly accelerated losses remain expected.