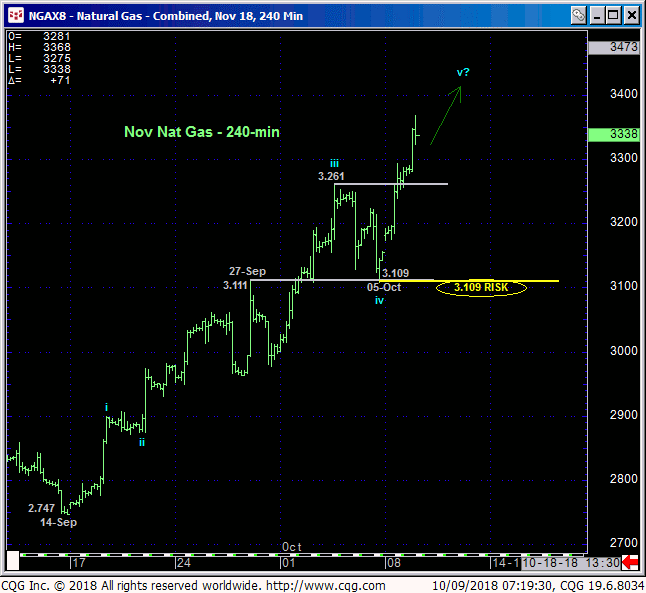
This week’s continuation of the increasingly impressive uptrend above last week’s 3.261 high reaffirms our broader bullish count and leaves Fri’s 3.109 low in its wake as the latest corrective low and new key risk parameter this market is now required to fail below to confirm the bearish divergence in momentum necessary to stem the bull and expose a bigger correction or reversal lower. In lieu of such sub-3.109 weakness the trend remains up on all practical scales and is expected to continue and perhaps accelerate. Per such 3.109 is considered our new key risk parameter from which a bullish policy can be objectively rebased and managed. Former 3.25-area resistance is considered new near-term support.
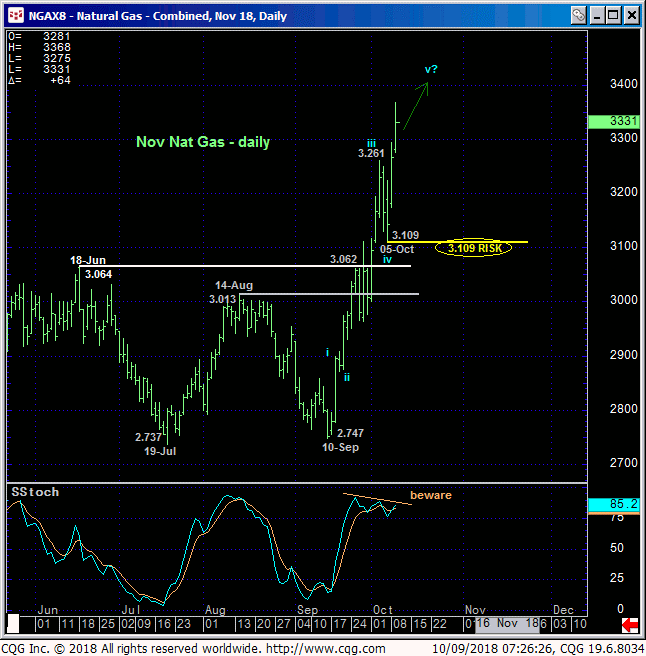
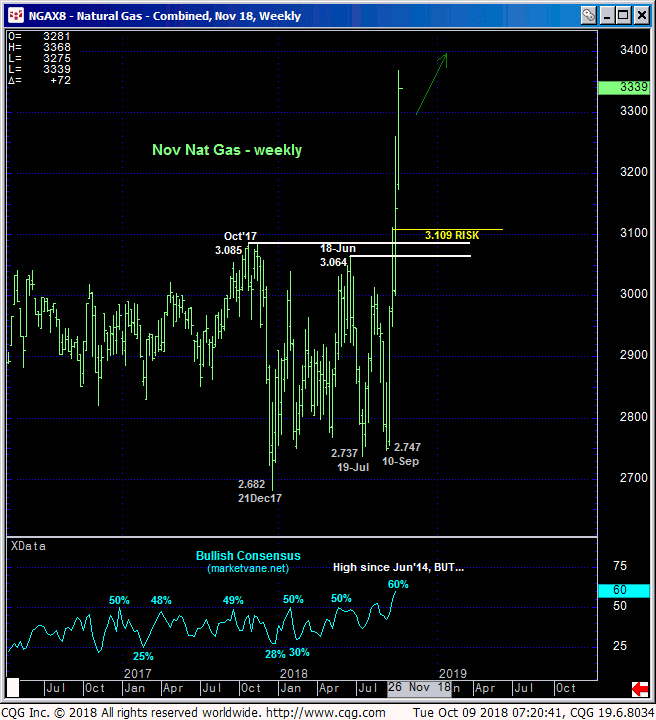
The daily chart above and weekly chart below of the Nov contract show the extent to which the market has blown away the prior TWO YEARS’ resistance around 3.05-to-3.08. The POTENTIAL for a bearish divergence in momentum is arguably developing on a daily basis, but proof of weakness below Fri’s 3.109 low is absolutely required to CONFIRM this warning to the point of non-bullish action like long-covers. In lieu of such sub-3.109 weakness, further and possibly steep gains remain expected.
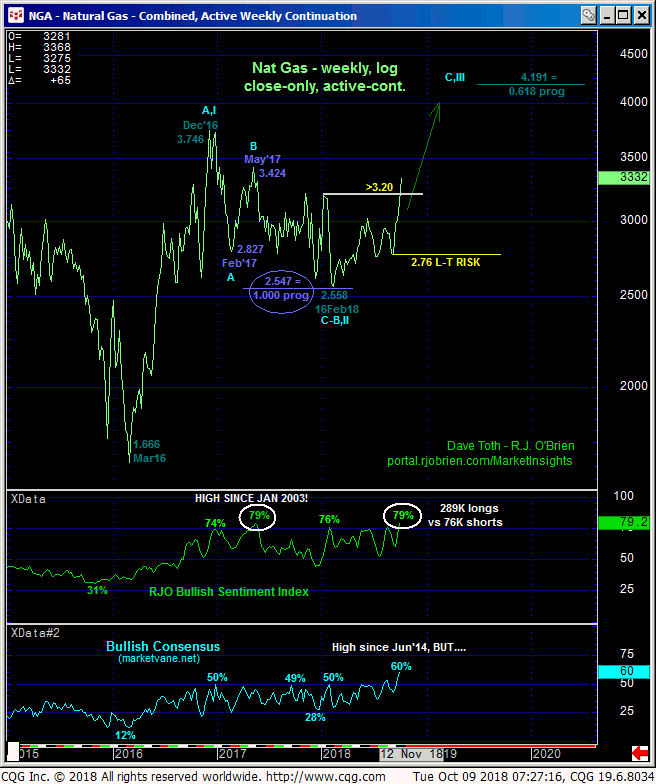
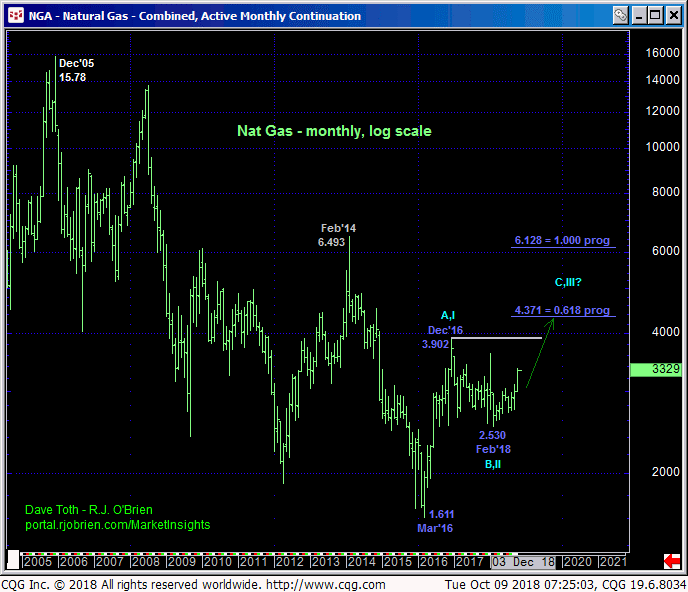
On an active-continuation and long-term basis this week’s recovery above Jan’s 3.20 high weekly close confirms the entire Dec’16 – Feb’18 sell-off attempt as a textbook 3-wave and thus corrective affair that warns of a resumption of 2016’s major uptrend that preceded it. Moreover, we would expect this rally to unfold in a very trendy, impulsive manner similar to 2016’s rally with the 0.618 and 1.000 progressions of that 2016 rally from Feb’s low ranging anywhere from 4.19 to 6.13 as labeled above and below.
The weekly chart above also shows the understandable return to historically frothy sentiment levels not seen since at least May’17 in our RJO Bullish Sentiment Index, which was the highest reading of managed money long positions since 2003. Such frothy sentiment levels are typical of major PEAK/reversal environments. But we would warn traders that sentiment/contrary opinion is NOT APPLICABLE as a technical tool in the absence of a confirmed bearish divergence in momentum needed to, in fact, break the clear and present uptrend. Herein lies the importance of our specific and objective risk parameter at 3.109.
In sum, a bullish policy and exposure remain advised with a failure below 3.109 required to negate this call and warrant its cover. In lieu of such weakness, former 3.25-area resistance is expected to hold as new near-term support ahead of further and possibly huge gains to what could be 4-year highs above 3.90.
