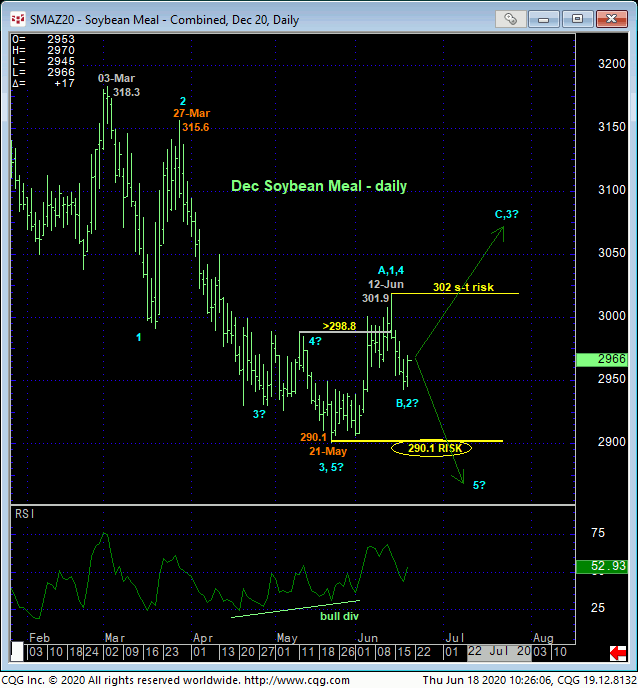
Since early-Jun, introduced in 04-Jun’s Technical Blog, we’ve been extolling the virtues of a base/reversal count that we believe could be major in scope. In Mon’s Technical Blog following that day’s bearish divergence in short-term mo that defined last Fri’s 301.9 high as the end of a textbook 5-wave Elliott sequence from 21-May’s 290.1 low, we discussed the prospect that this setback was likely the (B- or 2nd-Wave) corrective rebuttal to late-May/early-Jun’s 290.1 – 301.9 (A- or 1st-Wave) really within this broader base/reversal-threat PROCESS. Moreover, we advised to keep a keen eye on a relapse-stemming bullish divergence in momentum around the (294.6) 61.8% retrace of the initial 290.1 – 301.9 rally as reinforcing evidence of this broader base/reversal count.
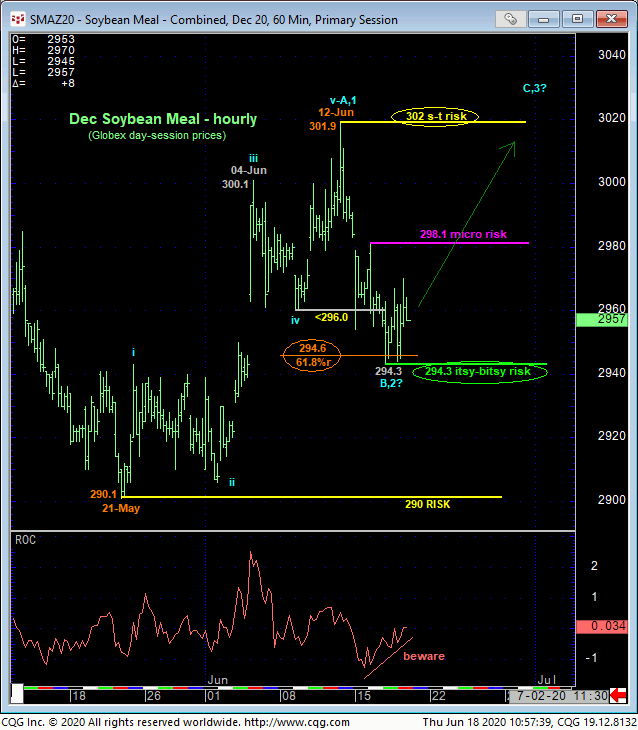
The hourly chart below shows the developing POTENTIAL for exactly the type of bullish divergence in momentum we describe above. The market needs to recoup Tue’s 298.1 smaller-degree corrective high and micro risk parameter from which scalpers can still base interim bearish trades. But while keeping in mind that 12-Jun’s 301.9 high remains intact as a short-term risk parameter the market needs to recoup to reaffirm our longer-term bullish count, this hourly chart below also shows this suspected corrective relapse thus far holding around the exact neighborhood of the (294.6) 61.8% retrace of the initial 290.1 – 301.9 rally with Wed’s low being 294.3.
Given longer-term evidence of a major base/reversal threat we’ll discuss below, and while admittedly jumping the gun on a confirmed bullish divergence requirement, we are identifying Wed’s 294.3 low as the B- or 2nd-Wave end to the correction and an itsy-bitsy but objective risk parameter from which traders can base a bullish punt ahead of what could be a very favorable return of eventual gains above 302.


The factors on which our longer-term base/reversal count remains predicated include:
- the market’s position in the lower-quarter of its massive FOUR YEAR lateral range that has repelled all previous sell-off attempts
- historically bearish sentiment not seen since 2006 and, in the case of the Bullish Consensus (marketvane.net), since 2001!
- a bullish divergence in daily momentum that defines 21-May’s 290.1 low as
- the prospective end to a 5-wave Elliott sequence down from 03-Mar’s 318.3 high.
This is a unique and compelling list of facts and observations typical of major base/reversal environments. A break below 21-May’s 290.1 low and key risk parameter is required to negate this call and re-expose the major bear. This is a fact. A recovery above 12-Jun’s 301.9 high will confirm this count and expose potentially extreme gains thereafter due to historically bearish sentiment that warns of upside vulnerability.
These facts leave us to deal with the price action between 290 and 302. On this smaller-degree stage, a recovery above 298.1 will tilt the directional scales to the broader bullish count while a relapse below 294.3 will reinstate at least the intermediate-term downtrend. Overall, we have identified four specific levels of various scales- 294.3, 298.1, 290.1 and 301.9- around which traders can make directional decisions commensurate with their personal risk profiles. In sum, a bullish policy remains advised for long-term players with a failure below 290 required to negate this call and warrant its immediate cover. Shorter-term traders are OK to maintain a neutral-to-cautiously-bearish stance until this market recovers above at least 298.1 and arguably 302. This said however, we believe the itsy-bitsy but objective risk parameter at 294.3 presents a potentially outstanding risk/reward opportunity from the bull side from at-the-market levels (295.8) for an eventual rally to 302+ levels. A relapse below 294.3 will not negate our broader base/reversal count, but it would negate this specific bullish punt and warrant its cover.

