Posted on Apr 12, 2023, 06:36 by Dave Toth
We’ve been approaching the interest rate sector from a base/reversal prospect since 10-Mar’s bullish divergence in momentum discussed in that day’s Technical Webcast, with last week’s rally reinforcing this count and leaving 29-Mar’s 114.07 low in its wake as the latest smaller-degree corrective low this market is minimally required to fail below to confirm a bearish divergence in momentum and defer or threaten it. Always trying to find flies in the ointment, we’d like to discuss an alternate (bearish) count that could come to the forefront if the market fails below 114.07, perhaps as a result of the upcoming round of inflation data starting with today’s release of the Mar CPI.
In the daily active-continuation chart of the contract below, we find it interesting that the resumed rally from 02-Mar’s 110.125 low has stalled in the exact neighborhood of the (116.295) 1.000 progression of last Oct-Dec’s initial rally from 108.265 to 115.115. This count contends that that 108.265 – 115.115 rally is the A- or 1st-Wave of a correction or reversal higher, with all of the price action from that 115.115 high to 02-Mar’s 110.125 low being the B- or 2nd-Wave correction. This correction calls 19-Jan’s 116.08 high the B-Wave “irregular” (i.e. it spiked to a new high above 115.115) within Dec-Mar’s correction lower.
This count suggests 06-Apr’s 116.30 orthodox high is either the completing C-Wave of a 6-month bear market correction or part of a major 3rd-Wave reversal higher. Commensurately larger-degree weakness below 02-Mar’s 110.125 larger-degree corrective low remains required to render the recovery from last Oct’s low a 3-wave and thus corrective affair that would then re-expose the secular bear market in the contract, but a near-term failure below 114.07 may provide an early warning of such.


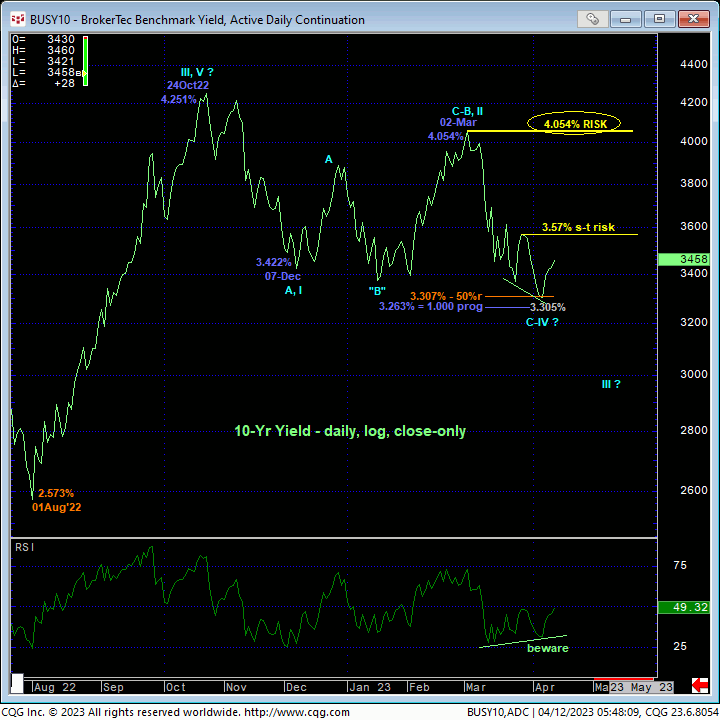
This bearish alternate count in the contract (i.e. count calling for HIGHER rates) becomes even more interesting when we consider actual 10-yr yields. The daily log close-only chart of 10-yr yields above shows the same wave count, only inverted, to that detailed above in the contract, with the nicely developing POTENTIAL for a bullish divergence in momentum. To CONFIRM this divergence however, the market needs to close above 28-Mar’s 3.57% smaller-degree corrective high. Interestingly however, last Thur’s 3.305% low close is sandwiched by the (3.307%) 50% retrace of Aug-Oct’s rally from 2.573% to 4.251% and the (3.263%) 1.000 progression of Oct-Dec’s 4.251% – 3.422% decline taken from 02-Mar’s 4.054% high.
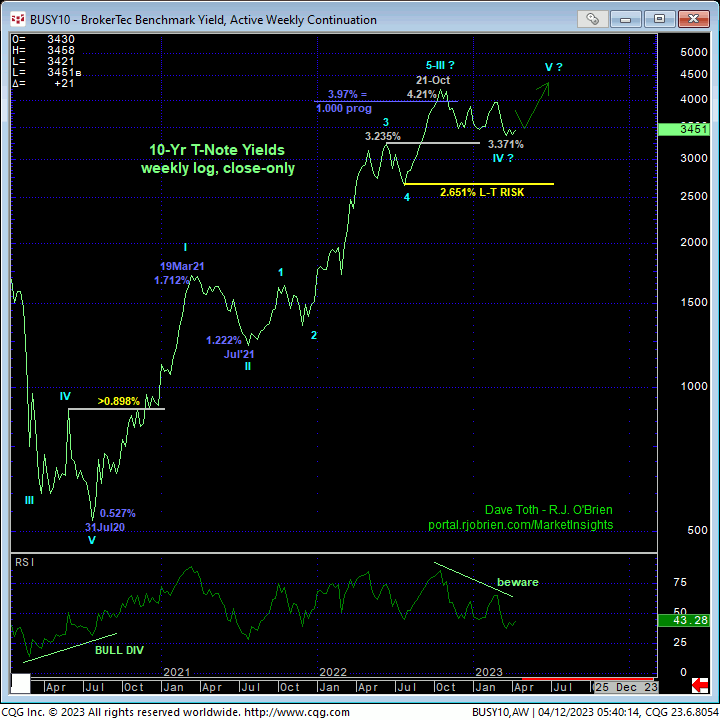
Additionally, on a weekly log close-only basis below, the past six months’ sell-off attempt is thus far only a 3-wave affair that remains above former 3.235%-area resistance from last Jun that, since obliterated by 3Q22’s rate explosion, is considered a new support candidate. If this alternate count that suggests the past six months’ setback is a 3-wave correction is correct, then we’d be looking for a (major 5th-Wave) resumption of the secular trend higher in interest rates. And this week’s latest round of inflation data may be the fuel to start such a move.
These issues considered, a bullish count and policy remain advised, although traders are urged to pare exposure to more conservative levels, with a failure below 114.07 required to move to at least a neutral/sideline position. Below, we discuss a cautious but favorable risk/reward strategy to bet on the bear side to position for a surprise in this week’s inflation data.

MAY 114-1/2 / JUN 111-1/2 PUT DIAGONAL
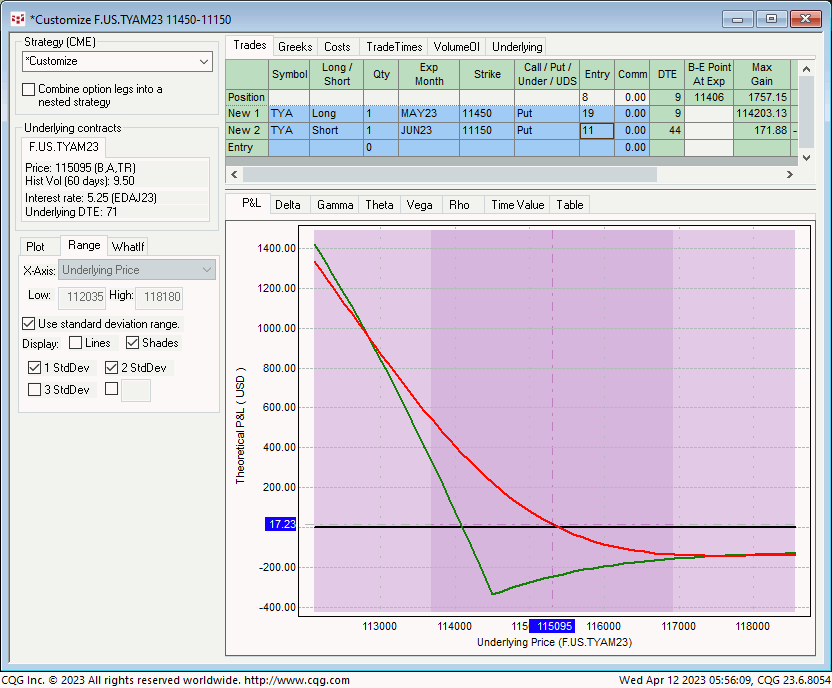
As a cautious but favorable risk/reward strategy to play for a bearish (in the contract) surprise by this week’s CPI and PPI data, we suggest buying the May 114-1/2 – Jun 111-1/2 Put Diagonal strategy for about 8/64s ($125/1-lot play). This strategy provides:
- a current net delta of -19%
- enviable gamma ratio of 3.5:1
- negligible risk if the underlying Jun contract resumes a major reversal higher
- profit potential of nearly three full points ($2,875 per 1-lot play) on a sustained reversal below 111-1/2 in the contract.
As always with long-gamma strategies, the gamma advantage comes in exchange for time decay (theta) risk. If the upcoming economic data are total duds and the underlying Jun contracts merely flatlines, then we act on the premise that the long 114.50 May puts will erode quickly to zero given only 9 days to expiration on 21-Apr. Left unmanaged, this would leave a naked short position in the Jun 111-1/2 puts that then would expose significant risk. And we NEVER let such a position get to that point. If the underlying Jun contract doesn’t MOVE SOUTH quickly and decisively by early next week, this strategy should be covered entirely for what should be a small loss. But should the market reverse lower and confirm a bearish divergence in momentum below 114.07, the long May 114-1/2 Puts will begin to behave like an aggressive short futures position, which would be preferred under that eroding technical structure.
Please contact your RJO representative for an updated bid/offer quote on the May 114-1/2 – Jun 111-1/2 Put Diagonal spread and good luck on today’s numbers.


