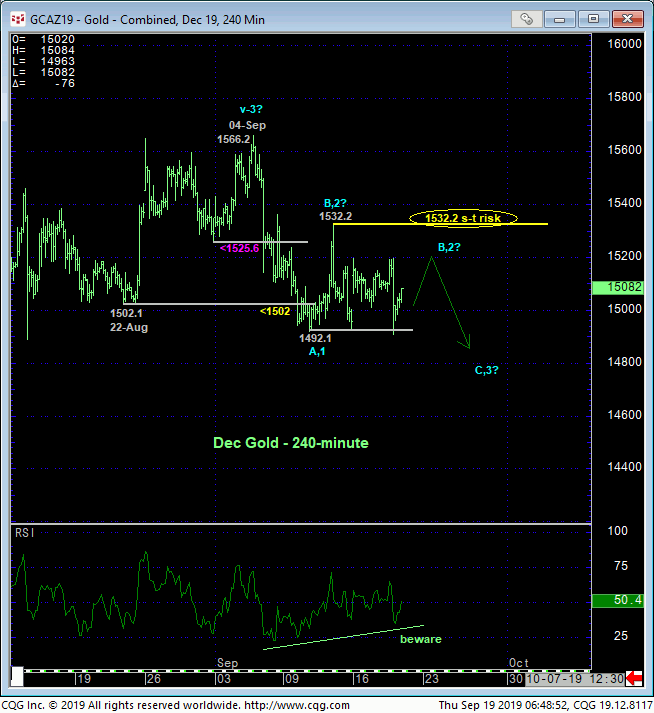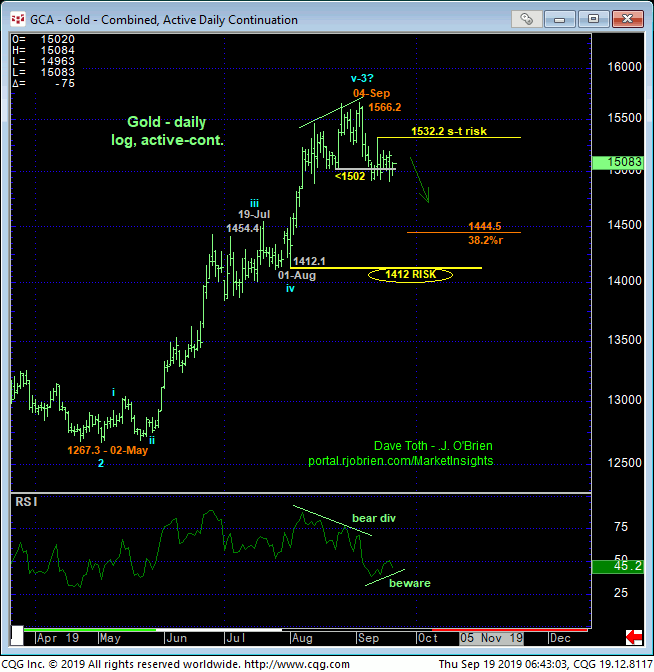
While the market’s break below the past week-and-a-half’s 1492/93-area support was short-lived, it nonetheless defines 12-Sep’s 1532.2 high as the end or upper boundary of a corrective/consolidative affair that warns of a resumption of early-Sep’s 1566.2 – 1492.1 downtrend that preceded it. Per such, we’re identifying that 1532.2 high as our new short-term risk parameter from which traders can objectively rebase and manage the risk of non-bullish decisions like long-covers and cautious bearish punts against the threat of a larger-degree correction or reversal lower.


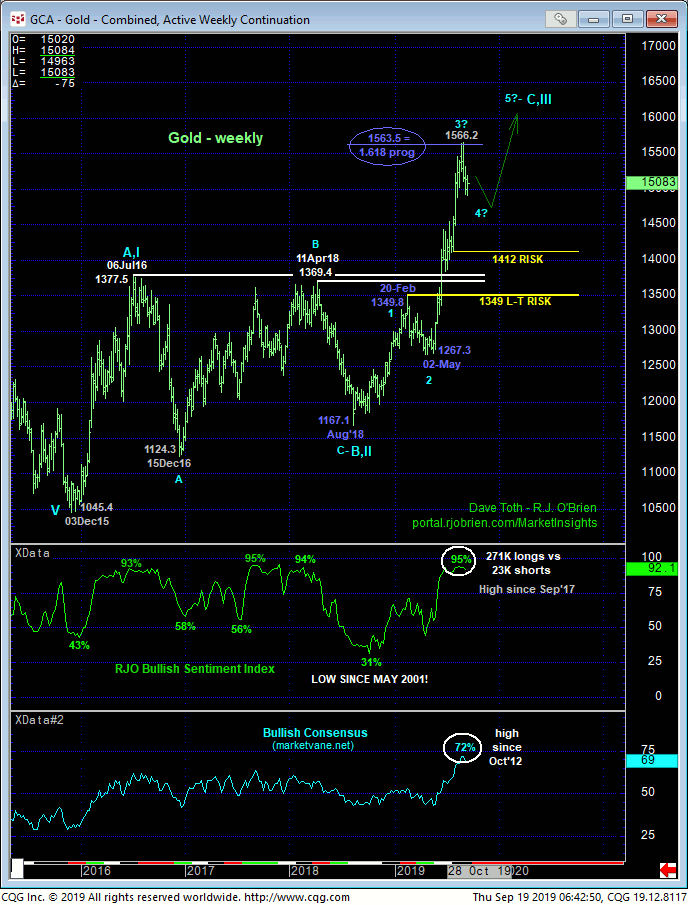
The combination of a confirmed bearish divergence in daily momentum shown above amidst historically frothy bullish sentiment/contrary opinion levels shown in the weekly log chart below is a unique and compelling one that warns of a larger-degree correction or reversal lower. Given the magnitude of even May-Sep’s portion of the past YEAR’S major uptrend, even a relatively small (4th-Wave) correction could be nominally severe. For example, even a Fibonacci minimum 38.2% retrace of May-Sep’s 1267 – 1566 rally doesn’t cut across until the 1445-area. But its exactly the extent and impulsiveness of this rally that suggests it may only be the 3rd-Wave of an eventual 5-wave Elliott sequence higher that warns that any such setback may only be a (4th-Wave) correction within the longer-term bull. On this larger-degree scale, commensurately larger-degree weakness below 01-Aug’s 1412.1 next larger-degree corrective low and key long-term risk parameter remains required to threaten a bull trend that dates back to Dec’15’s 1045 low.

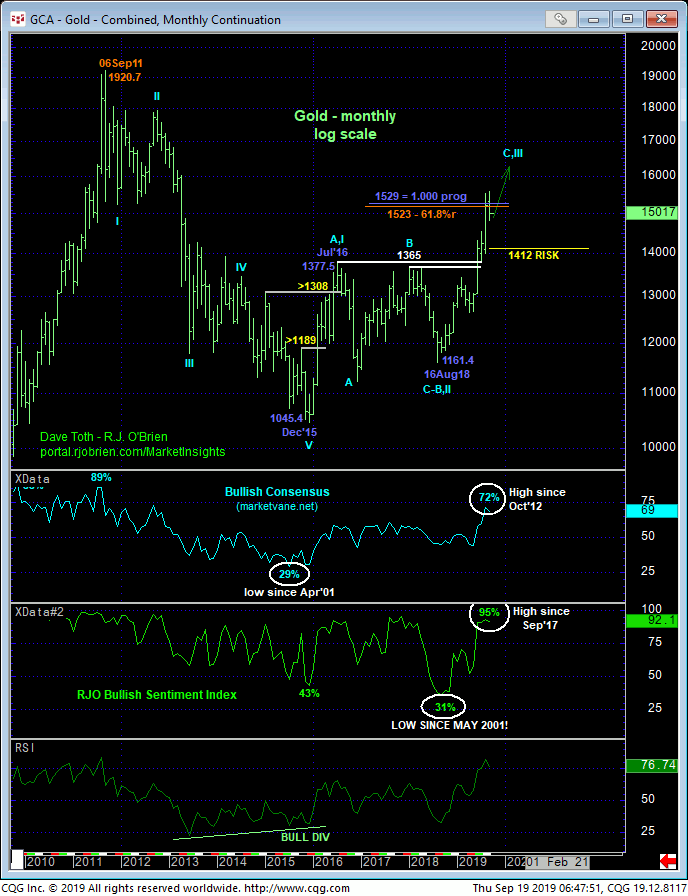
Finally, the monthly log chart below shows the magnitude of a nearly FOUR YOUR reversal that will likely require commensurately long-term peak/reversal behavior to counter it. But we find it interesting that this major recovery has found the going difficult lately around a pair of very long-term Fibonacci retracement and progression relationships that could mean the end of a major 3-wave correction from Dec’15’s 1045 low ahead of what could be quarters or even years of lateral-to-LOWER prices ahead. 1523 is the 61.8% retrace of 2011 – 2015’s 1920 – 1045 decline while neighboring 1529 is the 1.000 progression of DEc’15 – Jul’16’s initial 1045 – 1377 rally from Aug’18’s 1161 corrective low. Combined with the fact that, thus far at least, the entire recovery from Dec’15’s 1045 low has only sub-divided into a 3-wave affair, we cannot ignore the prospect of a longer-term bearish count that contends this entire nearly-4-year recovery is a major correction, especially given historically frothy sentiment conditions. Needless to say however, the past couple weeks’ erosion is of a grossly insufficient scale to conclude anything more than an interim corrective hiccup within a still-very-arguable major uptrend.
These issues considered, shorter-term traders are advised to maintain a neutral-to-cautiously-bearish stance with a recovery above 1532.2 required to negate this specific call and warrant its cover ahead of a possible resumption of the secular bull. Long-term players remain advised to maintain a cautious bullish policy with a failure below 1412 required to negate this call and warrant its cover. What the market has in store for us between these 1532.2 and 1412 directional triggers is anybody’s guess. We will be watchful for a relapse-countering bullish divergence in momentum that would tilt the intermediate-term directional scales higher and warrant a return to the bull side by shorter-term traders.


