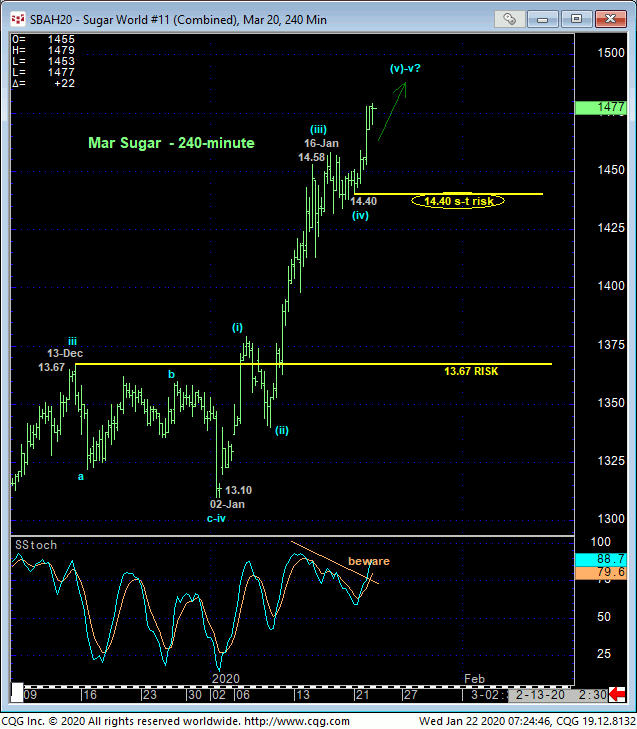
Today’s break above last week’s 14.58 high reaffirms the major uptrend and leaves yesterday’s 14.40 low in its wake as the latest smaller-degree corrective low this market is now minimally required to fail below to confirm a bearish divergence in short-term momentum needed to even defer, let alone threaten the bull. Per such, this 14.40 level is considered our new short-term risk parameter from which shorter-term traders with tighter risk profiles can objectively rebase and manage the risk of a still-advised bullish policy and exposure.


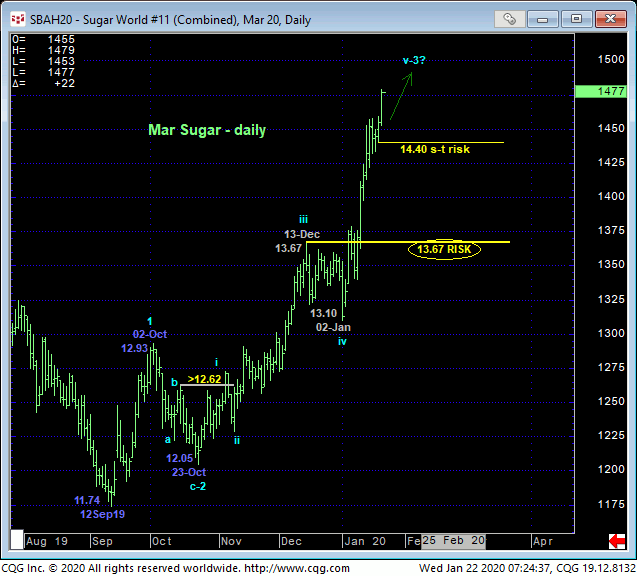
Only a glance at the daily chart above is needed to see that the major trend is not only up, but ACCELERATING, in full compliance with our multi-quarter base/reversal count introduced in 05Nov19’s Trading Strategies Blog. Commensurately larger-degree weakness below at least former 13.67-area resistance-turned-support from mid-Dec is minimally required to threaten this major bull. But given the 3rd-Wave “extension” that looks to be unfolding, we doubt any corrective setback comes anywhere near this longer-term risk parameter.
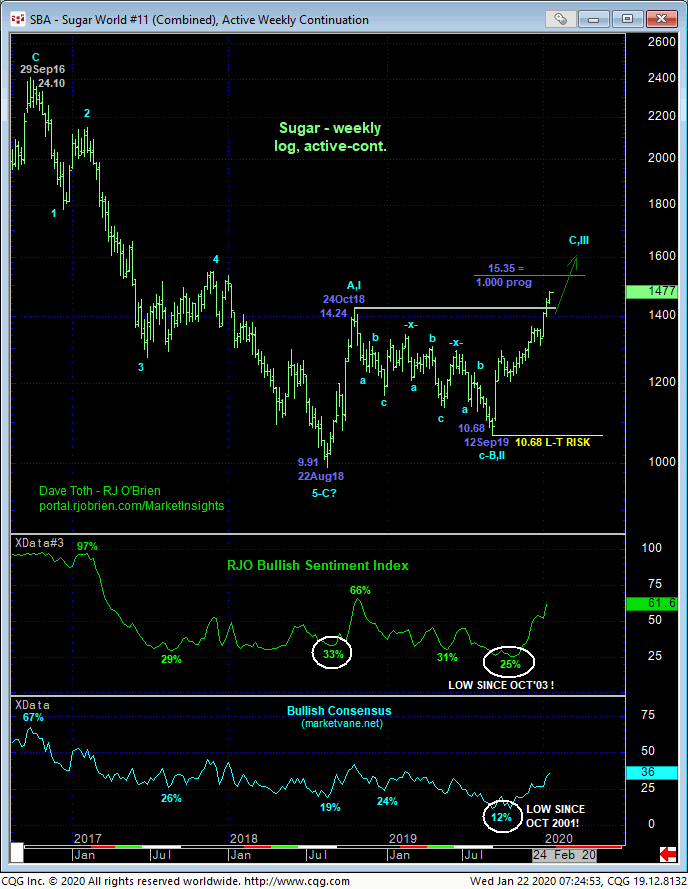
The weekly log active-continuation chart below shows last week’s breakout above Oct’18’s 14.24 high that confirms at least a major correction of Sep’16 – Aug’18’s 5-wave decline from 24.10 to 9.91 and potentially a major reversal that could span quarters and make a run at that 2016 high. playing the devil’s advocate, we’ve marked the (15.35) 1.000 progression of Aug-Oct’18’s initial 9.91 – 14.24 (prospective a-Wave) rally from Sep’19’s 10.68 (prospective B-Wave) low as a point/area around which to beware any kind of momentum failure that might then suggest the recovery from Aug’18’s 9.91 low is a major correction within the secular bear market to eventual new lows below 9.91. But a lot has to happen before giving up on a bullish count that could see this market rallying extensively for months or even quarters ahead.

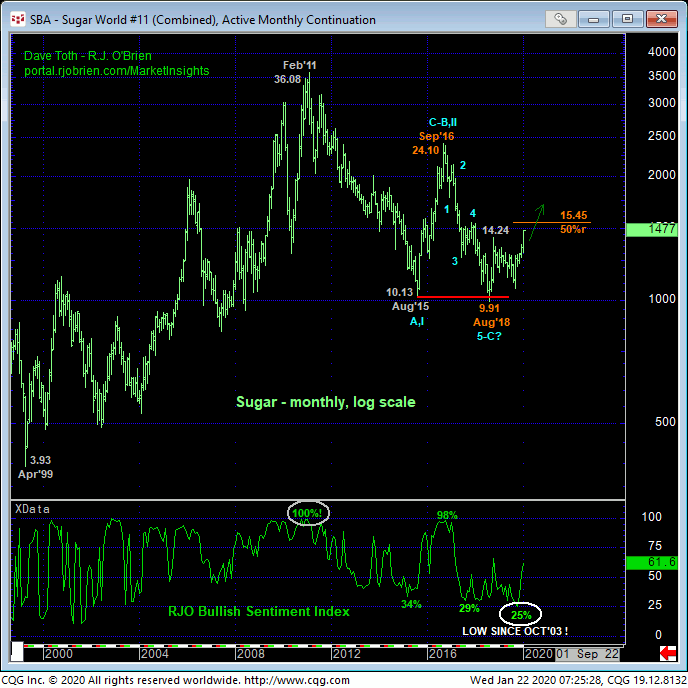
From a historic, monthly log perspective below, the past 17-month rebound still falls well within the bounds of a mere correction relative to Sep’16 – Aug’18’s 24.10 – 9.91 decline, let alone the secular bear market from Feb’11’s 36.08 high. But until and unless this market arrests this clear and present and major uptrend with
- a confirmed bearish divergence in momentum
- proof of trendy, impulsive behavior down and
- proof of labored, corrective behavior on a subsequent recovery attempt
the trend is up on all scales and is expected to continue and perhaps accelerate.
In sum, a full and aggressive bullish policy and exposure remain advised with a failure below 14.40 required for shorter-term traders to move to the sidelines and commensurately larger-degree weakness below 13.67 required for long-term players to take defensive measures. In lieu of such weakness, further and possibly accelerated gains remain expected.


