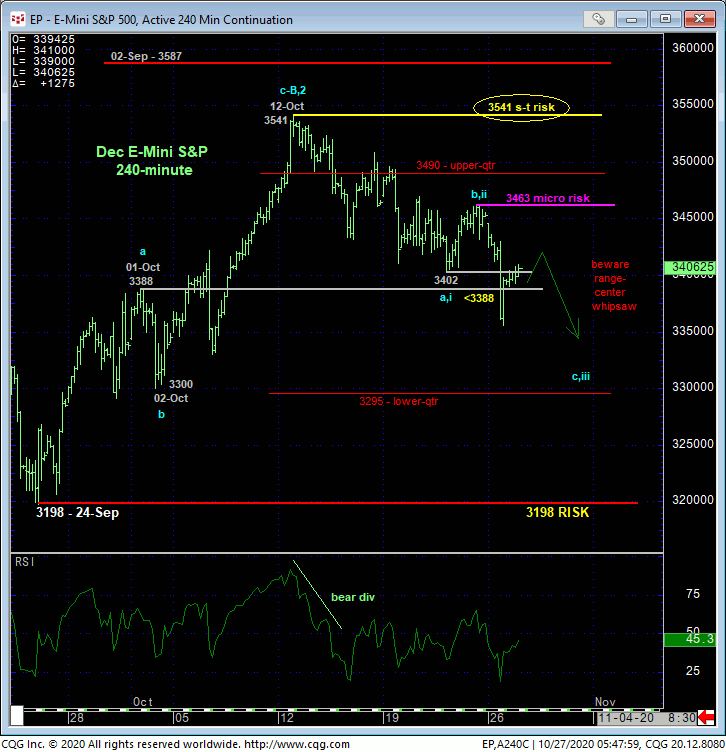
In 14-Oct’s Technical Blog we identified 01-Oct’s 3388 initial recovery high from 24-Sep’s 3198 low as a prospective 1st-Wave the market needed to sustain gains above to maintain a more immediate bullish count. The 240-min chart below shows the market’s failure below this short-term risk parameter yesterday that renders the recovery attempt from 3198 to 12-Oct’s 3541 high a 3-wave affair as labeled below. Especially stemming from the extreme upper recesses of the range that has constrained this market since 02-Sep’s 3587 all-time high, yesterday’s continued slide confirms that 3541 high as the B- or 2nd-Wave within a larger-degree peak/correction or reversal count.
On an even smaller scale, yesterday’s continuation of the now-two-week slide leaves Fri’s 3463 high in its wake as the latest smaller-degree corrective high the market is minimally required to recoup to defer or threaten a more immediate bearish count. In this regard, this 3463 level may be considered a micro risk parameter from which shorter-term traders can objectively base non-bullish decisions like long-covers and cautious bearish punts. This very short-term level may come in handy given the market’s position smack in the middle of Sep-Oct’s 3587 – 3198-range where the odds of aimless whipsaw risk are approached as higher, warranting a more conservative approach to risk assumption.

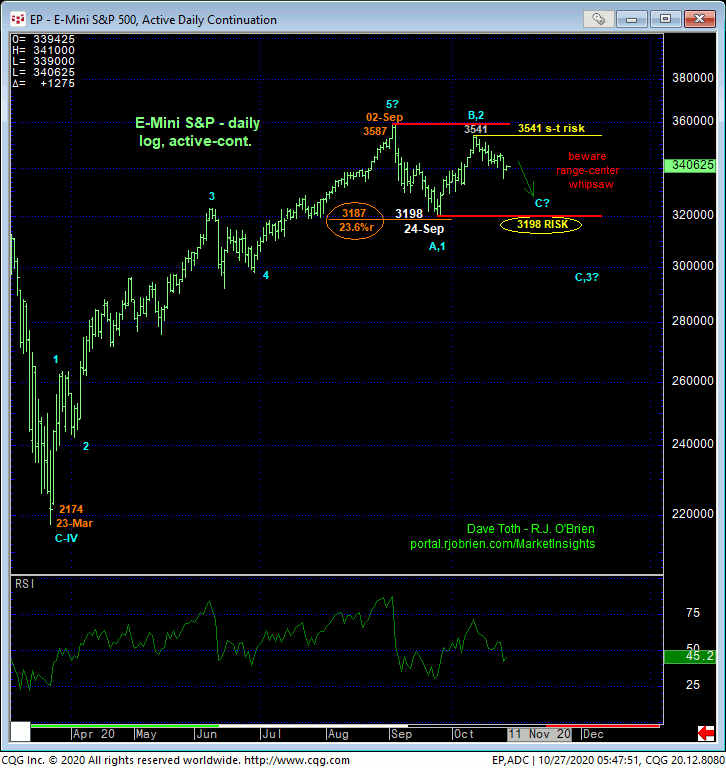
Taking a step back, the daily log scale chart below shows the lateral price action that has stemmed from 02-Sep’s 3587 all-time high. Against the backdrop of the secular bull trend shown in the weekly log chart below, longer-term traders are advised to first bias WITH this long-term trend and approach this lateral chop as a mere correction/consolidation ahead of an eventual resumption of the secular bull. Given short-to-intermediate-term weakness discussed above, further lateral-to-lower prices within this range are expected in days immediately ahead, perhaps to its lower-quarter between 3295 and 3200.
As recently discussed however, 24-Sep’s 3198 low is considered a pivotal one, the break of which exposes a vast chasm totally devoid of any technical levels or merit shy of this year’s 23-Mar low of 2174. This does not mean we’re forecasting a move to 2174 if the market breaks below 3198. But it certainly does mean that the market’s downside potential below 3198 is indeterminable and potentially severe, including a run at 2174 or below. Per such, this 3198 is considered our key long-term bull risk parameter. There will be no objective technical reason to remain long/bullish this market if it breaks below 3198.
Along these defensive lines, especially headed into next week’s election, an important by-product of the past couple weeks’ intra-range erosion is the market’s definition of highs, resistance and bear risk parameters it would be expected to sustain losses below IF it’s on the verge of a more protracted move south. These specific risk levels like 3541 and 02-Sep’s 3587 are the ones the market would ultimately have to recoup to mitigate a broader bearish count if the market breaks below 3198. Longer-term investors unwilling to accept potentially catastrophic nominal risk below 3198 can objectively exchange that risk for shorter-term whipsaw risk above levels like 3541 and certainly 3587.

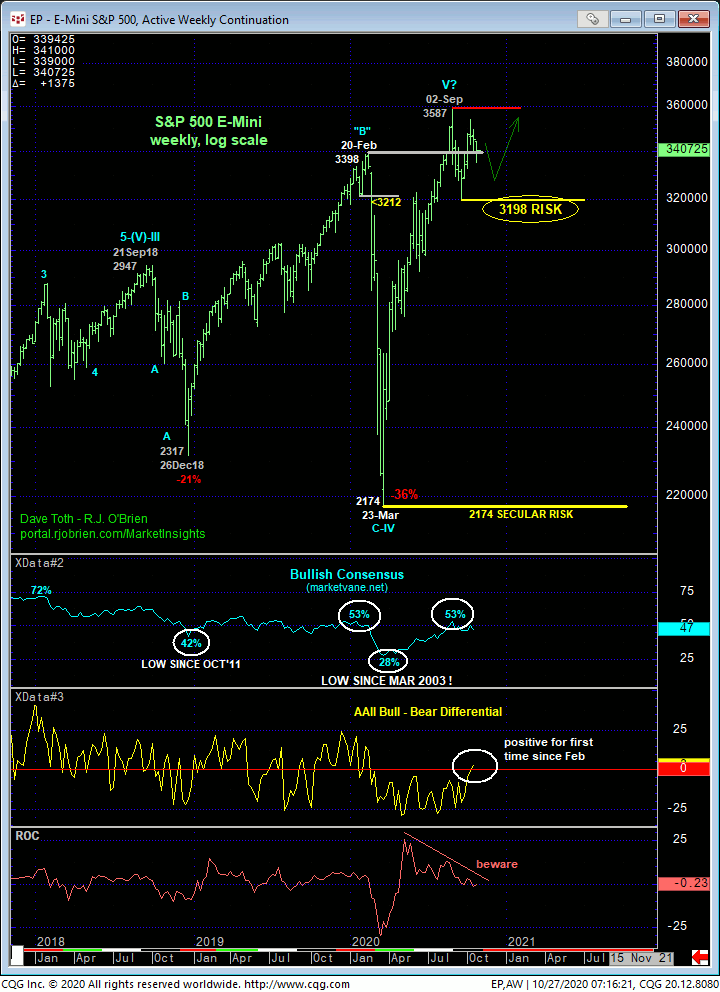
On a longer-term basis shown in the weekly log chart below, the importance of 24-Sep’s 3198 low as a key risk parameter should be obvious. We liken this level to 31-Jan’s 3212 low discussed in 24-Feb’s Technical Blog and previous updates before the market’s break below it and subsequent meltdown. At the time, we did NOT forecast a massive plunge. We only identified that level as one below which there was no objective technical reason for remaining long and bullish. The same technical discipline applies to our current environment and 24-Sep’s 3198 low.
The market could whipsaw below 3198 and come storming right back. And our objective answer and game plan to such a whipsaw is re-establishing a bullish policy and exposure above specific, identifiable levels like 3541 and certainly 3587. NOT neutralizing bullish exposure on a sub-3198 against the prospect of another meltdown leaves no such game plan to objectively manage the indeterminable and potentially monstrous risk that might lie below 3198.
Contributing to a peak/correction/reversal-threat environment are the following facts and observations:
- upside momentum that’s been waning for months (bear divergence CONFIRMED below 3198)
- an arguably complete 5-wave Elliott sequence up from 23-Mar’s 2174 low
- questionable/non-trending behavior after breaking Feb’s previous all-time high of 3398
- market sentiment/contrary opinion levels that have recovered to those that would be deemed bearish factors IF the market failed below 3198.
Indeed, for the first time since Feb, the American Association of Individual Investors Survey (AAII) bull-bear differential has posted a level above zero, meaning more with a bullish opinion than a bearish one. These bullish sentiment levels are far from egregious and won’t inhibit further and possibly steep gains AS LONG AS THE BULL MAINTAINS ITS MAJOR UPTREND. This uptrend has been “interrupted” and now requires a recovery above at least 3541 and certainly 3587 to be considered reinstated. A failure below 3198 however will, in absolute fact, confirm 02-Sep’s 3587 high as the end of the bull from the Mar low and start of a larger-degree correction or reversal lower that, as we’ve stated, would have indeterminable and potentially severe downside potential.
These issues considered, the intermediate-term trend remains down within a still-arguable correction/consolidation within the secular bull trend. A recovery above at least 3463 and preferably 3541 is required to defer and then negate the interim bearish policy and exposure recommended to shorter-term traders and warrant this policy’s cover. A bullish policy and exposure remain advised for long-term players with a failure below 3198 required to expose a peak/reversal threat that could be major in scope and warrant the immediate cover of all exposure to circumvent the depths unknown of a correction or reversal lower of indeterminable scope.


