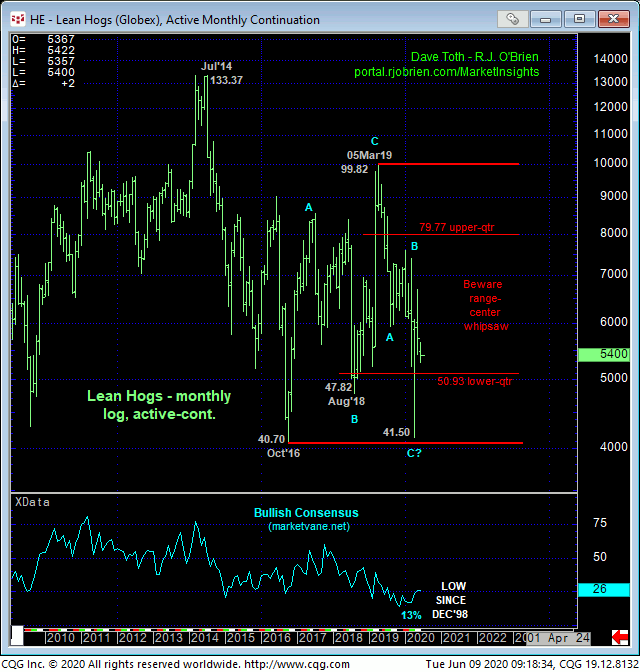
We’re going to begin with a monthly log scale chart of the most active futures contract below. This chart is still reflecting Jul contract prices, but should be rolling over soon to Aug. Since late-Apr’s bullish divergence in momentum discussed in 28-Apr’s Technical Blog, we’ve been of the opinion that the low for the past year’s debacle is in with 14-Apr’s 41.50 low in the then-prompt Jun contract and that May’s relapse is either the (B- or 2nd-Wave) corrective rebuttal of Mar-Apr’s rally OR the completing 5th-Wave of a broader Elliott sequence down depending on which contract is being considered.
Against this backdrop and as other contracts like Aug, Oct and Dec will be coming into play, what traders must acknowledge and have a game plan for is that these contracts are back in the middle-half bowels of a range that has constrained this market for over five years. As we always warn, such range-center environs are rife with aimless whipsaw risk that warrants a more conservative approach to risk assumption and highlights the importance of tighter but objective risk parameters regardless which direction you’re punting.


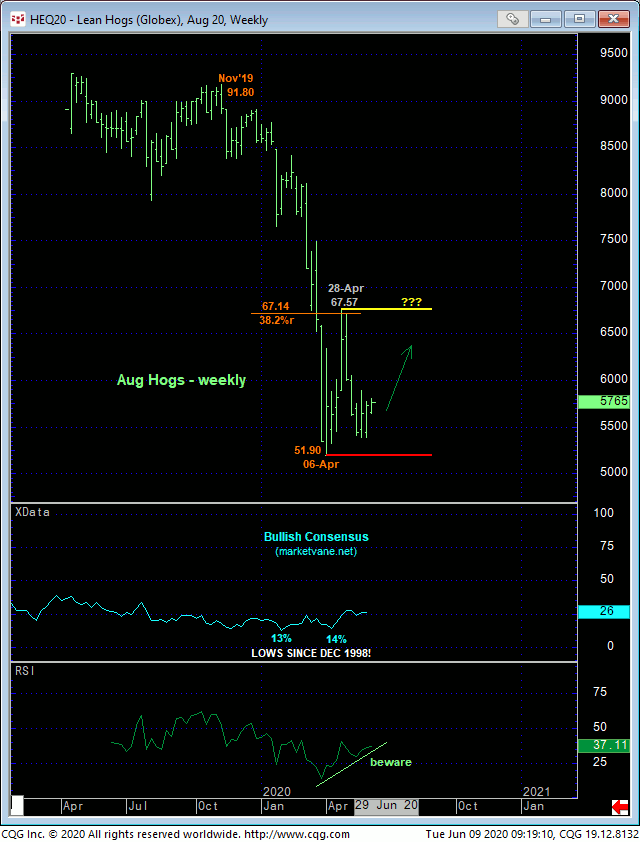
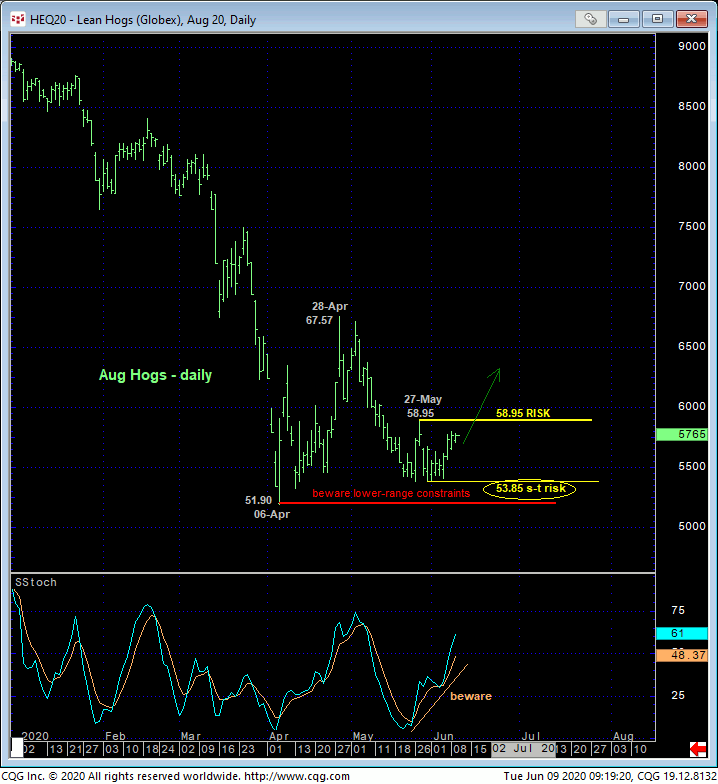
The daily (above) and weekly (below) charts of the soon-to-be-prompt Aug contract’s proximity to 06-Apr’s obviously key low at 51.90 amidst waning downside momentum and market sentiment that’s still closer to historical lows that continues to contribute to a broader base/correction/reversal count. On a weekly basis (above), commensurately larger-degree strength above 28-Apr’s 67.57 larger-degree corrective high remain arguably required to, in fact, break the major downtrend from last Nov’s 91.90 high. But waiting until that level- that’s even deeper in into the middle-half bowels of the long-term lateral range- to embrace a longer-term bullish policy doesn’t seem to make much risk/reward sense. Rather, we advise traders to acknowledge and accept smaller-degree whipsaw risk “down here” in exchange for greater nominal risk of waiting for higher prices to confirm a reversal.
A bullish divergence in DAILY momentum above 27-May’s 58.95 would only allow us to conclude the end of the downtrend from 28-Apr’s 67.57 high, NOT the major downtrend from last Nov’s high. But against the broader range backdrop and still low sentiment levels, we believe the risk/reward merits of bullish exposure “down here”, either just above 58.95 or at-the-market (57.70) are favorable.

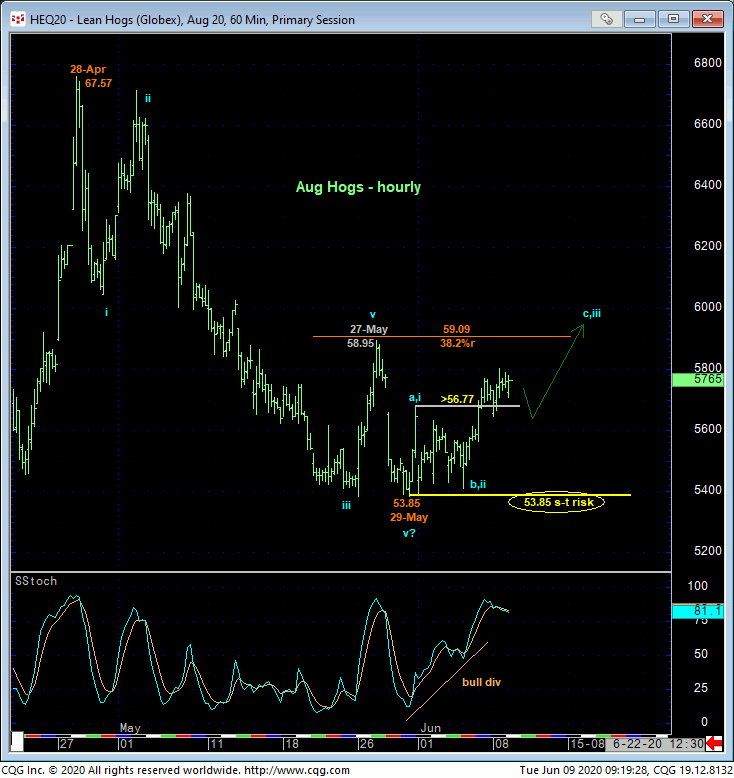
Finally, on a short-term basis detailed in the hourly chart below, Fri’s recovery above 29-may’s 56.77 initial counter-trend high confirms a bullish divergence in short-term momentum. This mo failure defines 29-May’s 53.85 low as one of developing importance and a short-term risk parameter from which non-bearish decisions like short-covers and cautious bullish punts can be objectively based and managed.
These issues considered, shorter-term traders are advised to move to a new cautious bullish policy and exposure at-the-market (57.70 OB) with a failure below 53.85 required to negate this call and warrant its cover ahead of the then-likely resumption of the major downtrend in the Aug contract. Longer-term players are advised to pare bearish exposure to more conservative levels and reverse into a new bullish policy on a recovery above 58.95, keeping in mind that the Oct and Dec contracts have already recovered above their analogous 27-May highs.


