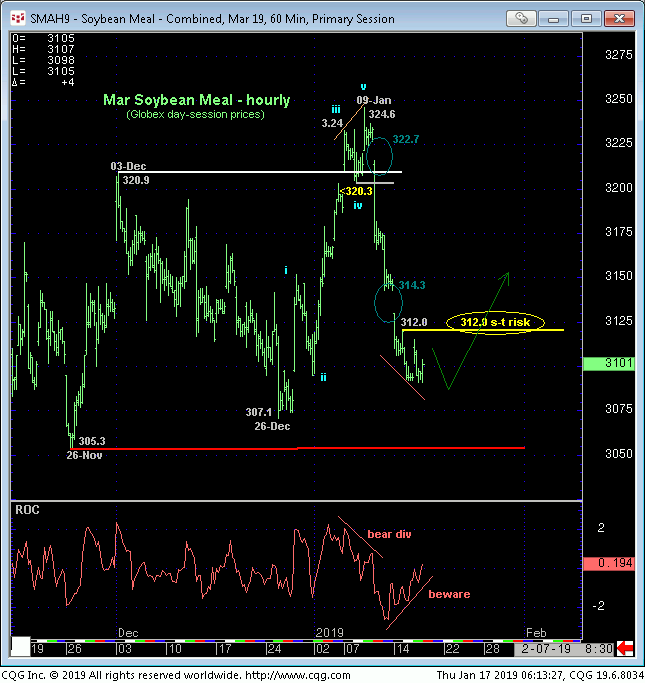
It’s the time of season when this elusive lunker can be found lying in the fertile weeds of a 5-month lateral range, just waiting for that bait of a bullish divergence in short-term mo to set the hook. The hourly chart below shows the past week’s sharp relapse, but no sharper than late-Dec/early-Jan’s spike higher that was stemmed by a bearish divergence in short-term mo with 10-Jan’s failure below 320.3.
The potential for a bullish divergence in the rate-of-change measure of momentum is developing nicely. But PROOF of “non-weakness” above Mon’s 312.0 very minor corrective high would be the first indication that this relapse has run its course, leaving the market vulnerable to a recovery. The fact that the past week’s swoon left two gaps-down offers added incentive for another intra-range rebound that could be as extensive as all the other intra-range swings the past five months.
Can buyers buy now (around 310) instead of having to wait for 312.0+ strength? Sure. But since this pre-bullish-divergence act breaks a rule of trying to catch the falling knife, such buyers, trying to set the hook early, are acknowledging and accepting risk to 26-Dec’s 307.1 low. Waiting to buy above 312.0 would leave a rejected/defined low in its wake like yesterday’s 309.1 low that would serve as a tighter but yet objective risk parameter and, more importantly, have the benefit of “buying strength” rather than fading a downtrend.


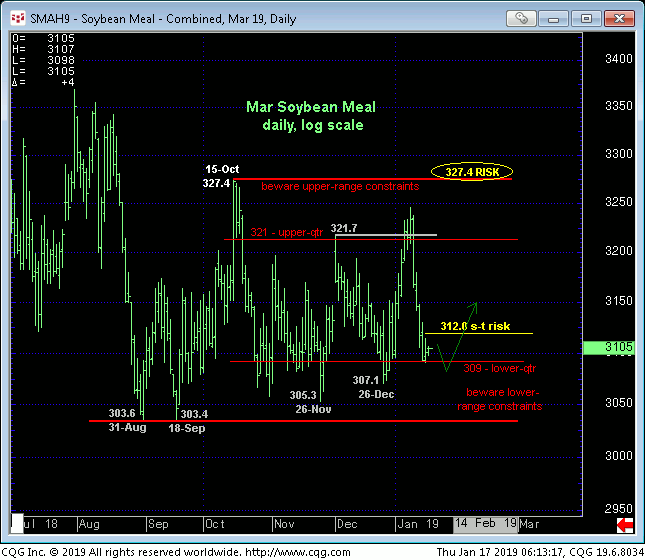
The daily log scale chart above shows the incessant 5-month lateral range and the market’s latest, current return to its lower-quarter (309-to-303) that has repelled EVERY sell-off attempt. If there’s a time and place to be watchful for another relapse-stemming bullish divergence in mo that would present another favorable risk/reward buying opportunity, it is here and now. And we will gauge such an intra-range trend reversal around Mon’s 312.0 minor corrective high.
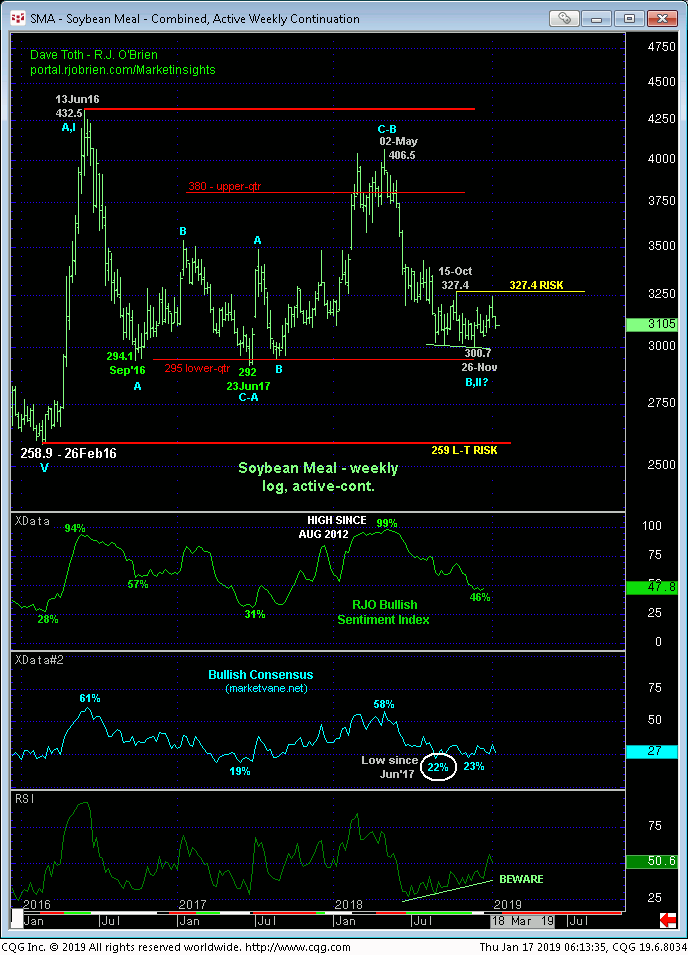
This bullish proposition also has the benefit of the market’s proximity to the lower-quarter of the multi-YEAR lateral range shown in the weekly log active-continuation chart below amidst historically bearish levels of market sentiment (although we acknowledge that our RJO Bullish Sentiment Index of Managed Money positions reportable to the CFTC has not been updated for a month because of the government shutdown).
Will the past week’s sharp, impulsive relapse be THE slide that breaks the past FIVE MONTHS’ massive support between 307 and 300? Perhaps. But it would be incumbent on such a big, bad bear to sustain trendy, impulsive behavior down. “Non-weakness” back above levels like 312.0 would threaten that alternate bearish count and reinforce a count calling for a continuation of the price action that has dominated this market for the past five months.
These issues considered, a neutral-to-cautiously-bearish stance remains OK, but only as long as the market sustains recent losses below 312.0. A recovery above this level would flip the script and create a favorable risk/reward opportunity from the bull side with protective sell-stops placed just below whatever low is left in the wake of that short-term mo failure.


