Posted on Jul 28, 2023, 07:54 by Dave Toth
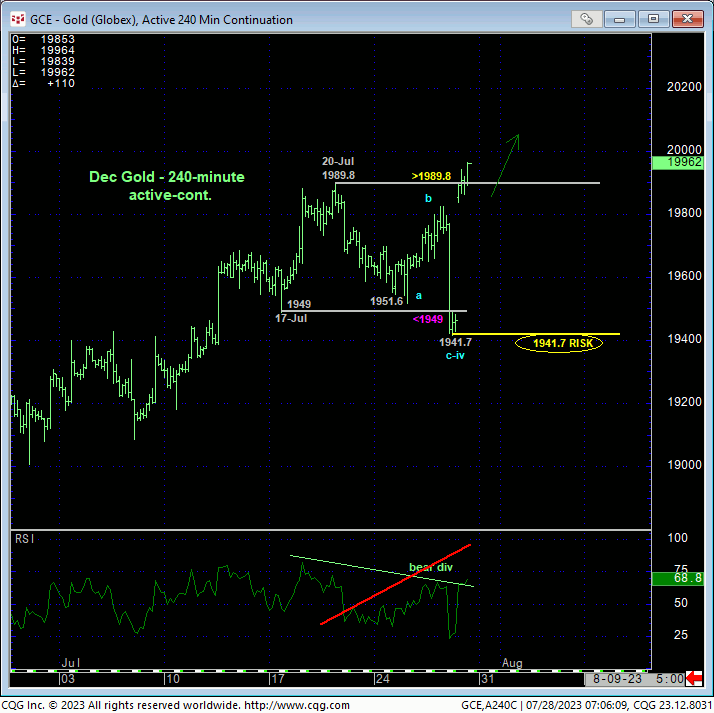
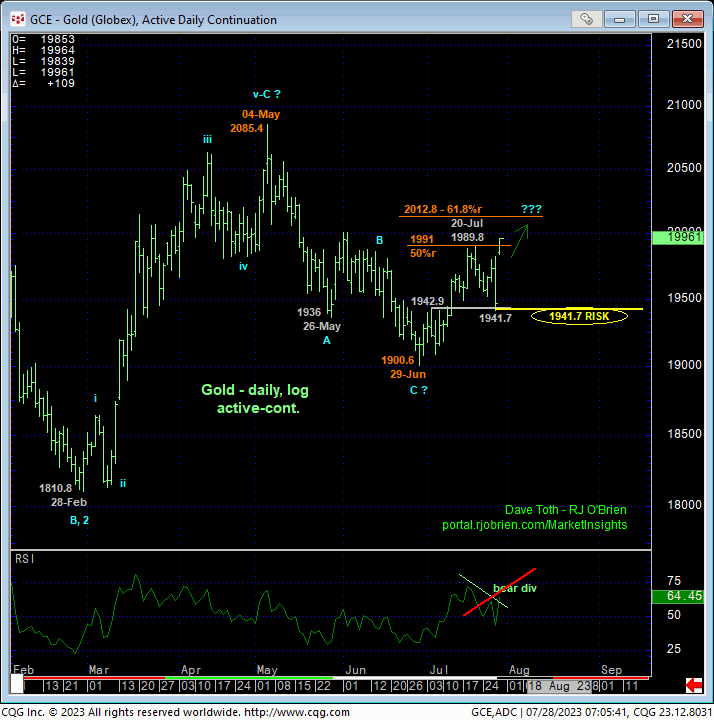
In yesterday’s Technical Webcast, we discussed yesterday’s 1982.6 high and 20-Jul’s 1989.8 high as the key Aug contract highs and bear risk parameters the market needed to stay below to maintain a more immediate bearish count following yesterday’s bearish divergence in momentum. On an active-continuation basis, the 240-min chart above and daily log chart below show today’s spike above these levels that nullify this divergence and resurrect the broader recovery from 29-Jun’s 1900.6 low. Today’s gap-up open and sharply higher prices are due totally to the future’s “roll” from Aug to Dec as the prompt contract month. On this active-continuation basis then, yesterday’s 1941.7 low would be considered the latest and key corrective low and bull risk parameter the market would now be expected to sustain gains above per any broader bullish count.
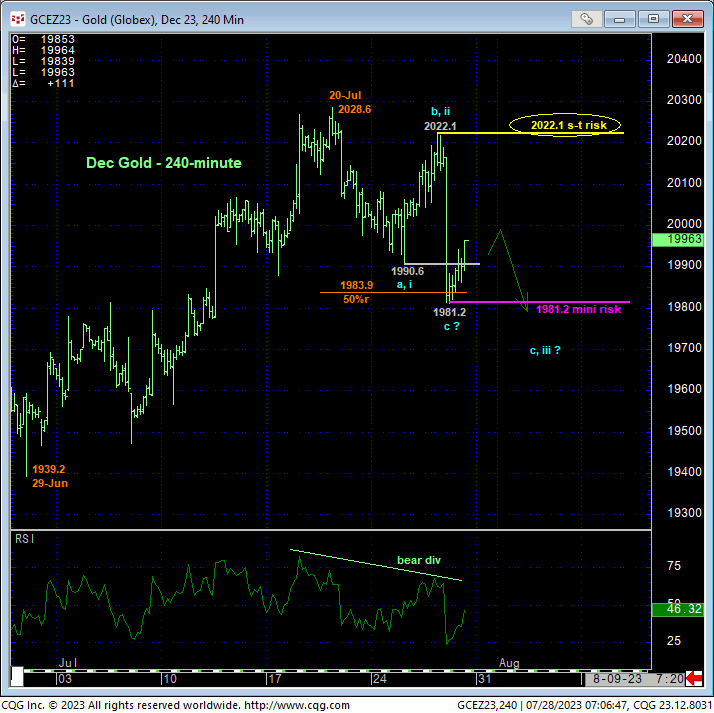
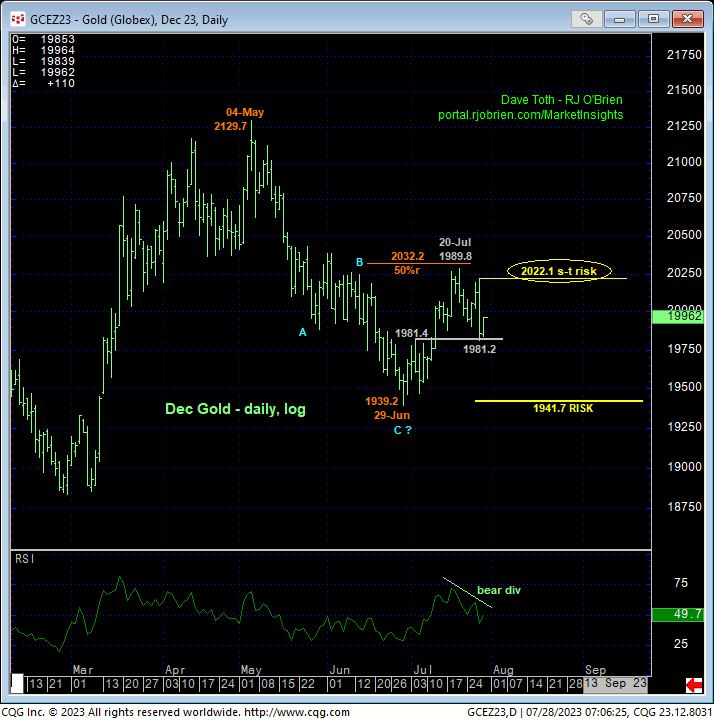
Considering just the Dec23 contract however, the 240-min chart above and daily log chart below show yesterday’s bearish divergence in momentum as still in effect, maintaining yesterday’s 2022.1 high as THE corrective high his contract needs to recoup to render the past week’s sell-off attempt a 3-wave and thus corrective structure needed to resurrect a broader recovery from 29-Jun’s 1939.2 low. In this regard, yesterday’s 2022.1 high remains intact as a short-term bear risk parameter this market needs to recoup to mitigate the prospect of a deeper correction or reversal lower and resurrect a broader bullish count.
The daily log chart below shows yesterday’s 1941.7 low in the Aug contract and how it stacks up against Dec contract prices. Trying to address the vagaries of one of the more complicated contract rolls, we believe these two levels- 1941.7 from a longer-term bull perspective and 2022.1 from a shorter-term bear perspective- define the most pertinent flexion points around which to toggle directional exposure commensurate with one’s personal risk profile.
This said, we’d also like to throw in yesterday’s 1981.2 low as a very, very tight level from which short-term traders may want to toggle directional exposure, being cautiously bullish while this level holds and cautiously bearish below it if it doesn’t. For IF the active-continuation perspective is correct and the past week’s setback is just a 3-wave correction, the daily chart of the Dec contract below shows an area of former resistance at 1981.4 from 05-Jul that thus far has held as new support at 1981.2. Regardless, a recovery above 2022.1 in the Dec contract remains required to CONFIRM the past week’s sell-off attempt as a 3-wave and thus corrective affair and reinforce a broader bullish count.
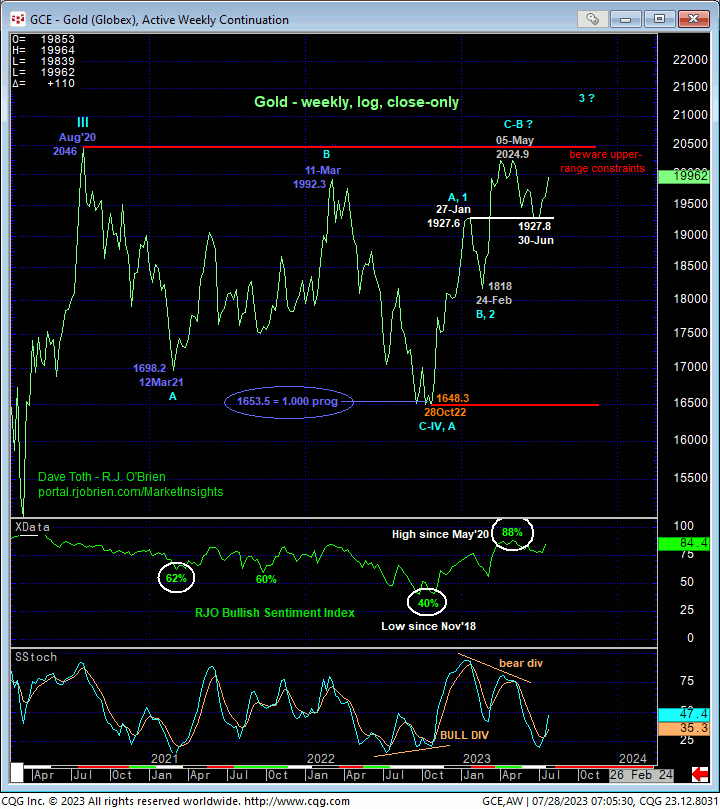
Lastly and still consistent with a broader bullish prospect, the weekly log close-only chart below still shows late-Jun’s 1927.8-area of former resistance from late-Jan as a key support area. To resurrect a larger-degree peak/correction/reversal lower, from the extreme upper recesses of the past THREE-YEAR range, a relapse below AT LEAST the 1941.7 low on an active-continuation basis and especially below this 1927-area is required.
These confusing contract-roll issues considered, we believe this market has identified 2022.1 (from the short-term bear side), 1981.2 (from the mini bull side) and 1941.7 (from the long-term bull side) as the key flexion points around which traders can objectively toggle directional exposure commensurate with their personal risk profile. With the inevitable breaks of these levels, we will update traders accordingly. Acknowledgement of and flexibility to either directional outcome is urged.
