The third week of May 2020 saw some increased volatility in the US indices, with the NASDAQ outshining its counterparts and maintaining its generally bullish trend.
In currencies, aside from a slow drift upwards in the US Dollar Index and the weakness coming into the British Pound Futures, there was little significant change. The most interesting shift appears to be in Gold and Silver, with both metals beginning to push higher.
As the number of new daily cases of COVID-19 continues to decline, the focus shifts to each of the states and the pressure they are under to end their lockdowns. This week could reveal how the re-opening will impact the pandemic numbers. The general scientific expectation is that re-opening will trigger a second wave of infections with a second shock to the economic system. There is a counter-belief the threat is exaggerated and that a return to pre-virus business conditions is of primary importance. Any upturn in cases or fatalities could impact an economic recovery.
The next proposed stimulus package now awaits final approval – and it may not be resolved this week.
The key economic calendar news events to watch this week are:
- Federal Reserve Chair Jerome Powell speaks – Tuesday and Thursday
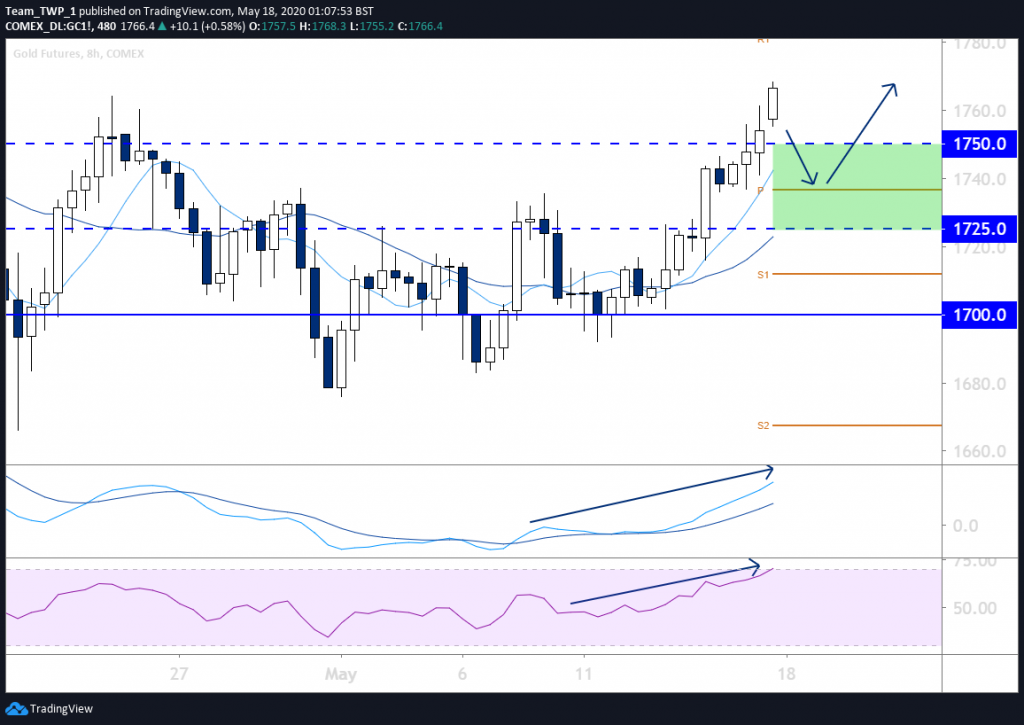
Gold, 8-hour/Daily, Bullish
There is an uptrend on the monthly, weekly, and daily timeframes, with momentum indicators supporting the bullish sentiment.
On the daily chart – or even the eight-hour timeframe – should price retrace down towards the buy zone area between the 8 & 21 period moving averages (MAs) there may be an entry opportunity into the next move up.
The zone highlighted in green represents an area where there is more than one reasonable potential place for price to generate an entry signal.
The recent support levels of 1,750 and 1,725 could be ideal levels to target long entries.
Included in this zone is the monthly central “P” pivot.
A suitable profit target would be ahead of the 1800 level.
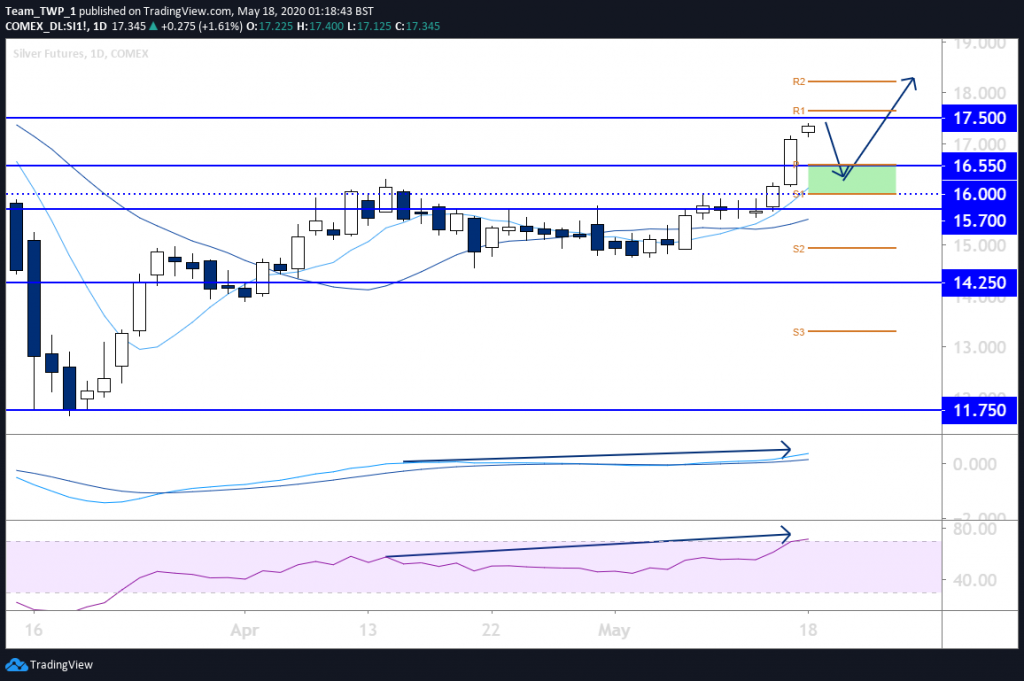
Silver, Daily, Bullish
Although the Silver monthly chart is largely unclear, both the weekly and daily charts show uptrends with higher-highs and higher-lows, with supporting bullish momentum indicators.
The daily chart may retrace back down to the 8 and 21 MAs and/or the recent support at 16.00 and then provide an entry into the next possible extension higher.
There is also a monthly pivot level in the green highlighted area, which could add to possible support. There is resistance at 17.50, and so taking partial profits ahead of this level may assist against potential rejections.
A small bullish candlestick forming in the buy zone of the MAs could provide an efficient entry.
Risk management will be key, so a stop-loss is imperative, in order to protect capital exposure against unforeseen outcomes.