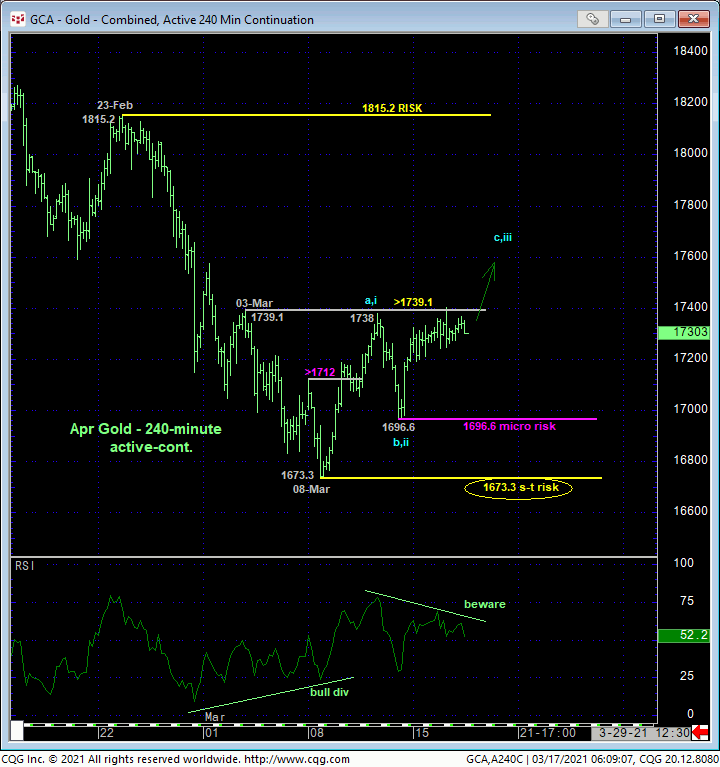
Against the backdrop of a 7-month downtrend, the past week-and-a-half’s recovery attempt is of too small a scale thus far to be approached as anything more than another interim corrective bounce. Nonetheless, yesterday’s poke above 11-Mar’s 1738 initial counter-trend high and our short-term risk parameter defined by 03-Mar’s 1739.1 corrective high confirms a bullish divergence in short-term momentum that breaks at least the downtrend from 23-Feb’s 1815.2 next larger-degree corrective high and key long-term risk parameter. As a result of this bullish divergence in short-term mo, the 240-min chart below shows that the market has rejected/defined 08-Mar’s 1673.3 low as one of obvious developing importance and Fri’s 1696.6 low as the latest smaller-degree corrective low it is now minimally required to fail below to render the recovery from 1673.3 a 3-wave and thus corrective structure consistent with the still-unfolding 7-month bear. Per such, 1696.6 and 1673.3 serves as our new micro- and short-term risk parameters from which shorter-term traders with tighter risk profiles can objectively base non-bearish decisions like short-covers and cautious bullish punts.

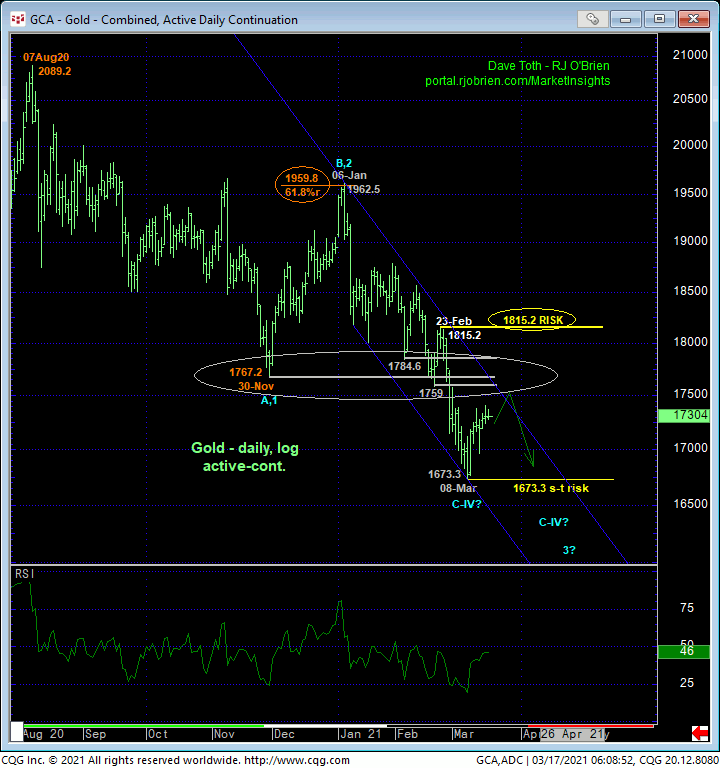
Taking a step back, the magnitude of the 7-month downtrend s crystal clear in the daily log scale chart below with key former support from the 1760-to-1785-area, since broken in late-Feb, now an equally key new resistance candidate. If the decline from 06-Jan’s 1962.5 high is the 3rd-Wave of a major reversal lower, this 1760-to-1785-area resistance should hold like a Chicago Bears tackle ahead of further and increasingly obvious, trendy, impulsive behavior lower. A recovery above this area in general and above 23-Feb’s 1815.2 larger-degree corrective high and key risk parameter specifically will not only negate a broader bearish count, it will reinforce a major bullish count calling for a resumption of the secular bull to new highs above 2089.


What’s potentially fascinating about this bullish count is that:
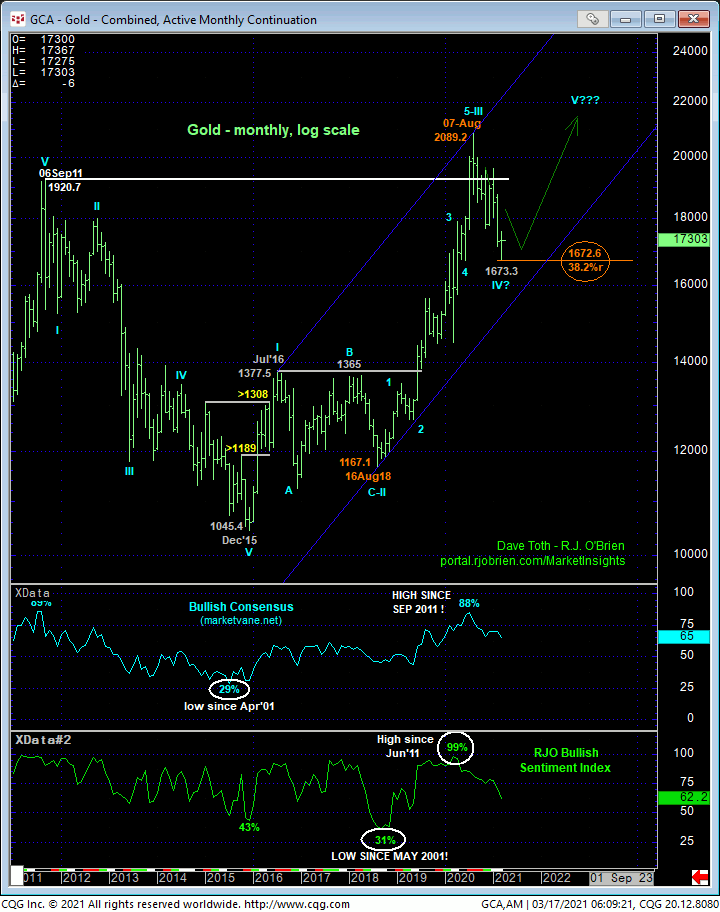
- the sell-off attempt from last Ag’s 2089 all-time high is thus far only a 3-wave affair that falls well within the bounds of a mere correction within the secular bull
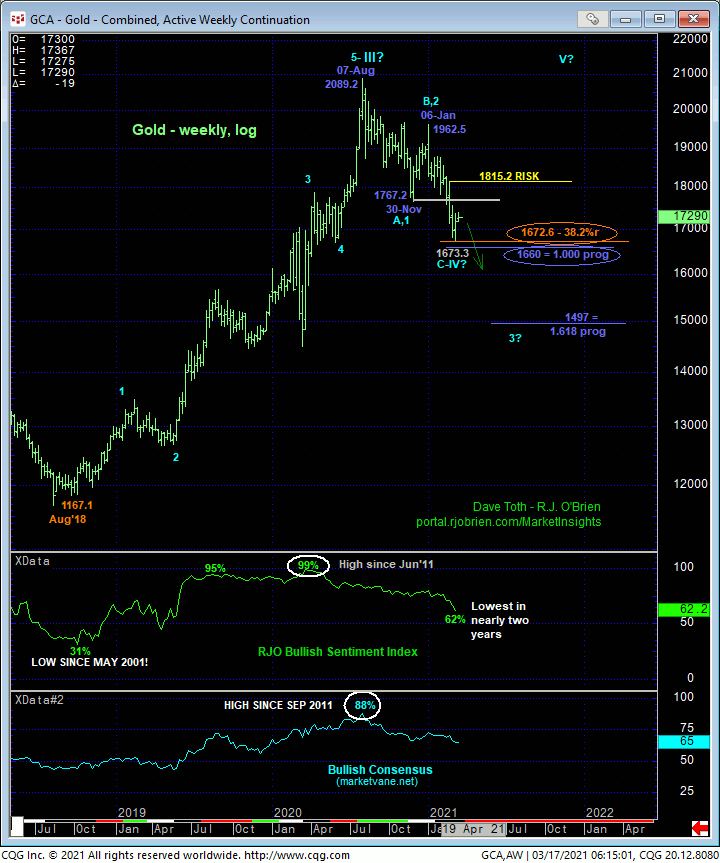
- 08-Mar’s 1673.3 low is less than a dollar from the Fibonacci minimum (1672.6) 38.2% retrace of Aug’18 – Aug’20’s 1167.1 – 2089.2 rally on a log scale basis
- 08-Mar’s 1673.3 low is just 13-bucks from the 1.000 Fibonacci progression of Aug-Nov’s initial 2089.2 – 1767.2 decline from 06-Jan’s 1962.5 high (where the C-Wave would equal the A-Wave in length)
- our RJO Bullish Sentiment Index of the hot Managed Money positions reportable to the CFTC has eroded to its lowest, least-bullish level (62%) since May 2019.
Now NONE of these facts means a thing until and unless the market confirms a bullish divergence in momentum of a sufficient SCALE to break the downtrend from at least 06-Jan’s 1962.5 high. And herein lies the specific and critical importance of 23-Feb’s 1815.2 larger-degree corrective high and key risk parameter. In effect, the short-term trend is up within the long-term trend that remains arguably down. A relapse below at least 1696.6 and preferably below 1673.3 is required to stem the short-term recovery and re-expose the major bear while a recovery above 1815.2 s required to stem the major downtrend and resurrect the secular bull. Traders are advised to toggle directional biases and exposure around these levels commensurate with their personal risk profiles.


