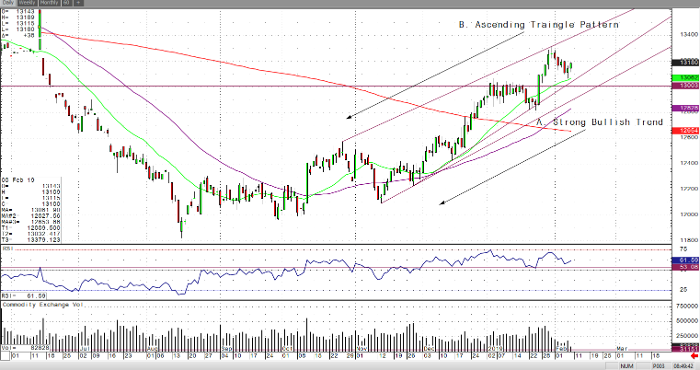
In the early morning trade, April gold is slightly up trading at $1,316.7 an ounce and has held up strong in the eyes of a strengthening U.S. dollar. Yesterday, the gold bulls came in aggressively when gold approached $1,305 and with the revelation that a trade deal with China will not be finalized by the March first mandate. This gave the bulls that extra confirmation they need to hold on for higher gold prices. Furthermore, a Goldman Sachs analyst, stated that he sees more buying by central banks in 2019 and an ongoing inflow of gold and silver ETFS.
If we take a quick look at a daily April gold chart, you’ll clearly see the strong bullish trend that it has been in since the start of mid-November. It is above all its major moving averages and is in a bullish ascending triangle pattern, which I highlighted as well. The bull camp has the technical and fundamental advantage as of now, but if you’re a gold bear and looking to short this market, be careful with risk and try and short it at the top of the ascending triangle, which you can see has caused this market some pull backs as in bullish trend.
Gold Apr ’19 Daily Chart


