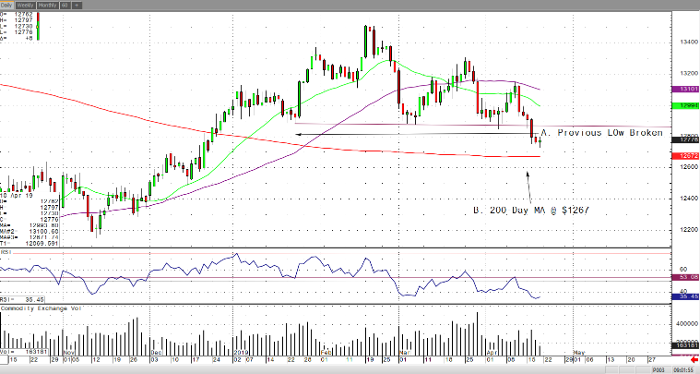
In the early morning trade, June gold has continued its sell off, currently trading at $1,276, which began last week on the 11th after a strong 51-year low jobless claims number. Gold has struggled recently with global equity markets signaling risk off with a possible U.S./China trade deal near and along with continued strong macro-economic data overnight. The U.S. dollar continues to strengthen off strong economic news which has caused more pressure to gold and the news overnight that a South Africa gold mining company will be back up and running again after a five-month strike won’t help the shiny one either. Furthermore, with the Fed indicating yesterday a possibility still for another rate hike later this year one would think the bear camp has clear control for now.
If we take a quick look at the daily June gold chart, you’ll clearly see that on Tuesday it broke below the previous three lows which acted as support. Moreover, now it sets up a sell off down to its 200-day moving average which rest at $1,267 an ounce or even lower.
Gold Jun ’19 Daily Chart


