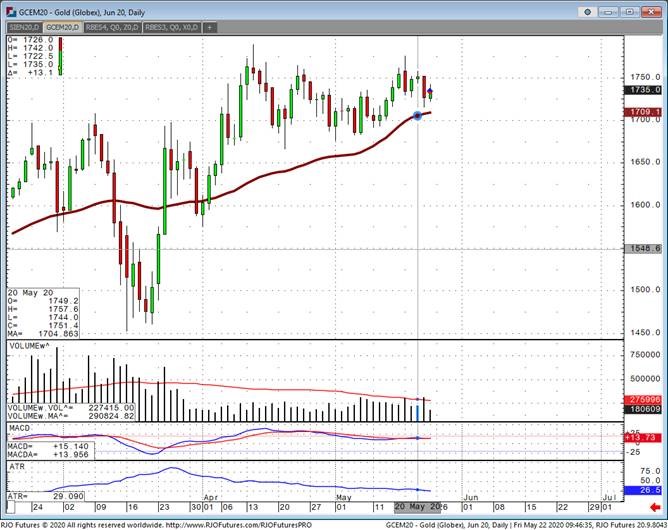
June gold futures have once again, showed strength over the past week pushing just short of the contract high of 1789 back in March, only to fall back toward 1735 as of this morning. It’s difficult to say whether we will be able to make new highs given the stock market strength, and the endless sideways price action over the past few months. One could just look at the chart of June gold and conclude on a daily chart gold is a buy around 1675, and a sell around 1750 and it’s been that simple. Gold ETF’s continue to expand their physical for the 20th straight week, unrest in Hong Kong with China’s recent crackdown, and explosive federal government spending are all reasons to be long gold.
The technicals though, again, seem to have the edge here as we saw strong above average volume yesterday and a solid close lower. Today we have minor strength but likely an inside day in the end. The April 22nd and May 1st spike lows in gold are a clue to where the near-term bottom is, which is around 1675. The same could be seen around 1750. Volume is a big clue when coupled with price action to see what’s really going on in gold (or any market for that). Traders right now need to position themselves for a neutral to moderately bullish outlook, and custom strategies based on your market bias and risk tolerance can be created by contacting me directly.