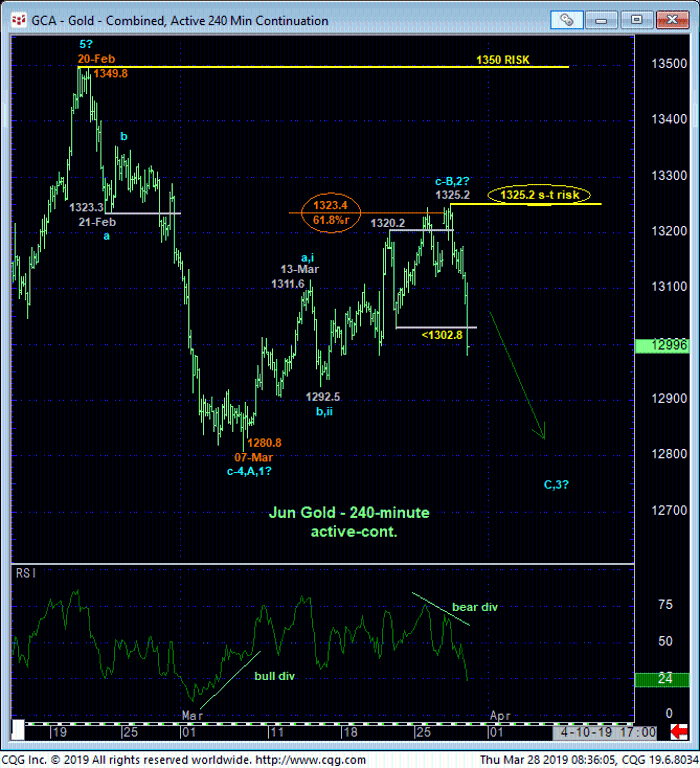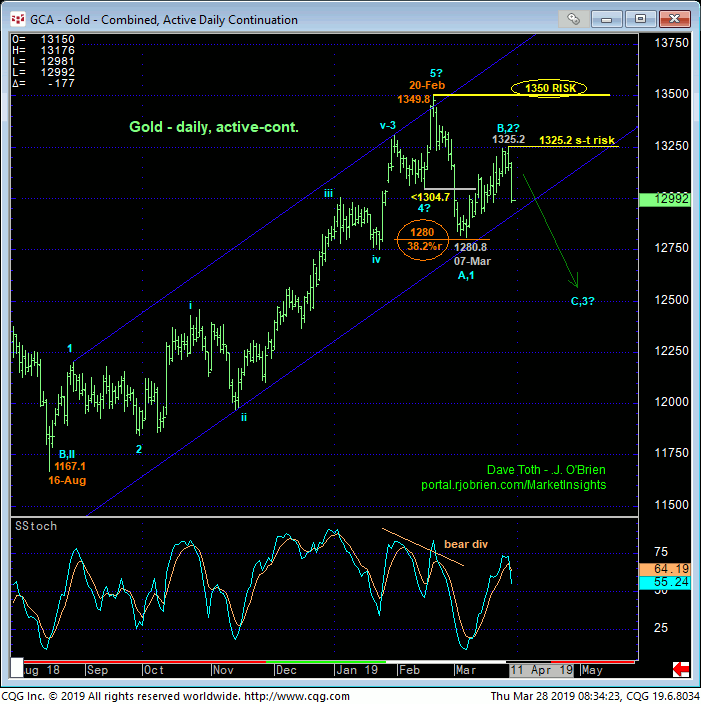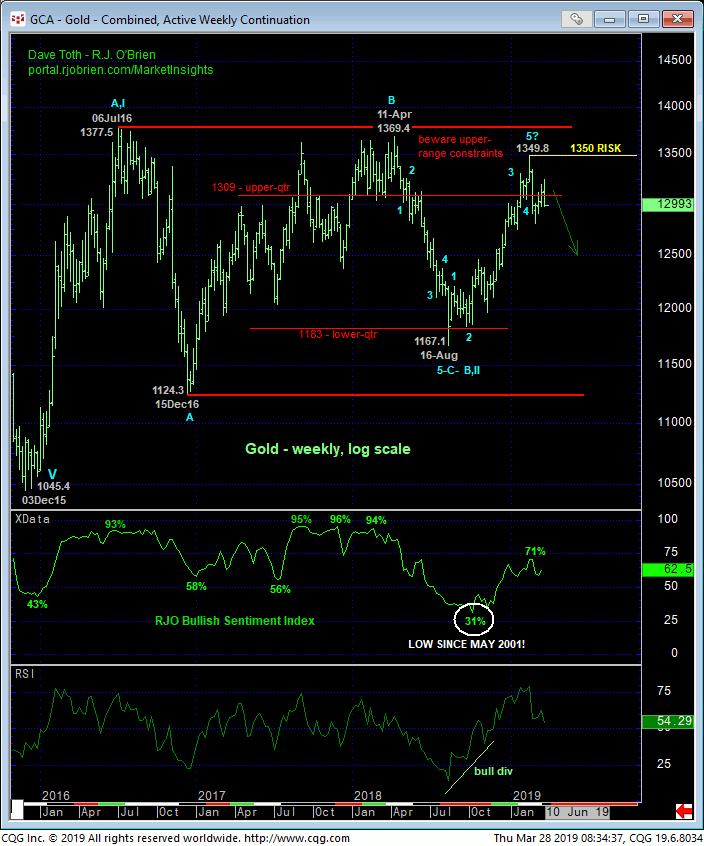
Mirroring the silver market’s failure this morning and it’s revival of a broader peak/reversal count, the gold market’s failure below 21-Mar’s 1302.8 minor corrective low confirms a bearish divergence in momentum that not only stems the past few weeks’ recovery attempt, but also resurrects a broader peak/reversal threat that could be major in scope. This mo failure defines yesterday’s 1325.2 high and near-61.8% retrace of Feb-Mar’s initial 1349 – 1280 break as the prospective end to a (B- or 2nd-Wave) correction and our new short-term risk parameter from which non-bullish decisions like long-covers and bearish punts can be objectively based and managed.


Traders are reminded that today’s short-term mo failure comes on the heels of:
- 01-Mar’s bearish divergence in daily momentum from
- the extreme upper recesses of the 2-1/2-YEAR lateral range amidst
- a return to relatively frothy bullish sentiment levels and
- an arguably complete 5-wave Elliott sequence up from 16Aug18’s 1167 low.
With today’s mo failure arguably rendering the past few weeks’ recovery a 3-wave and thus corrective structure, the market has satisfied all three of our reversal requirements:
- a confirmed bearish divergence in momentum
- proof of trendy, impulsive behavior on the initial counter-trend break and, most importantly,
- proof of 3-wave, corrective behavior on a subsequent recovery attempt.
Left unaltered by a recovery above at least 1325.2, we anticipate a resumption of Feb-Mar’s initial countertrend decline to new and potentially significant new lows below 1280.8. Per such, long-term players remain advised to maintain a bearish policy with strength above 1325.2 required to threaten this call enough to warrant its cover. Shorter-term traders with tighter risk profiles whipsawed out of bearish exposure after 13-Mar’s bullish divergence in momentum are advised to return to a bearish stance from 130 OB with a recovery above 1325.2 required to negate this call and warrant its cover. We anticipate a run at -7-Mar’s 1280 low and below straight away.


