In the early morning trade, April gold is currently trading up $14/oz due to this morning’s non-farm payroll numbers reporting a meager 20,000 jobs added in February, which is the smallest increase in 17 months and maybe signs of a slowdown in the economy. The shiny one acted as a safe-haven off the announcement and investors and traders alike flocked back in to buy off these nearly six-week lows and currently trading at $1,299 an ounce. However, besides the technical uptrend being broken in gold, which I’ll get to in a moment, you have good data in this report like the two previous months being revised up by 12,000. The unemployment rate fell to 3.8% from 4.0% and unemployed workers tumbled by 300,000, and another surprise was the continued strength in average hourly earnings topped both monthly and annual estimates with a 0.4% rise from January and 3.4% from a year earlier, the fastest pace of the economic expansion.
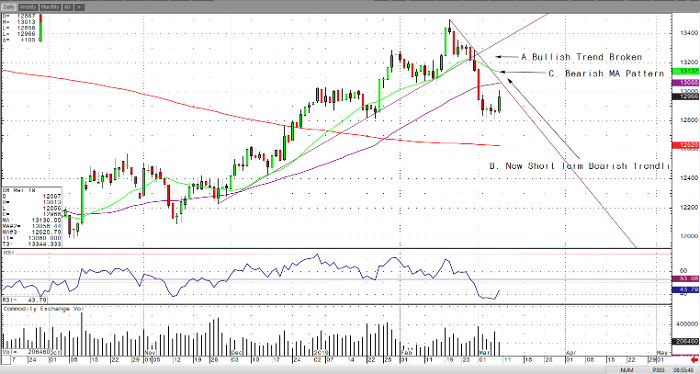
Take a quick look below at the daily April gold chart and you’ll clearly see between February 27th & 28th that it’s bullish trend which was started back in November was technically breached by trading below causing it to sell off roughly another forty dollars an ounce. The shiny one again is approaching the $1,300 handle; however, I highlighted below a short term bearish trend line along with a bearish moving average pattern which the 20-day is sloping down looking to cross below the 50-day moving average. If this bearish moving average pattern happens it can perhaps cause golds sell off to continue at least a little while longer.
Gold April ’19 Daily Chart

If you would like to learn more about metal futures, please check out our free Fundamental of Metal Futures Guide.


