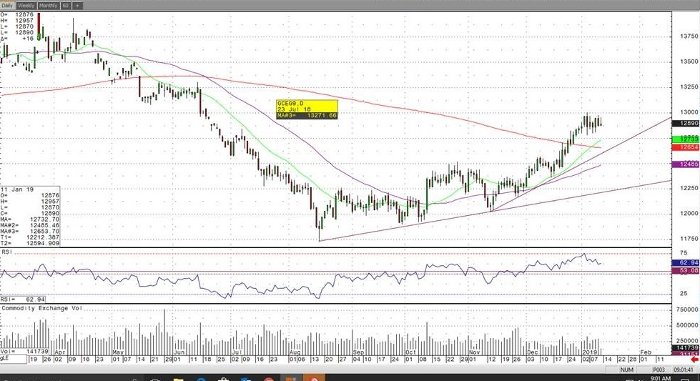
In the Friday morning trade, February gold is slightly in the green and currently trading at $1,289.7 a troy ounce. Since the middle of December, the gold market and the U.S. dollar have been closely tied together, especially this week. For example, the shiny one sold off on Thursday as the greenback recovered and then vice-versa in the overnight trading session. Some might say that gold is overbought after it couldn’t hold above the $1,300 an ounce handle last Friday. However, I would be careful to think gold can’t trade higher with the numerous ongoing issues such as: US/China trade negotiations, US Government shutdown, and you could even say Brexit. If these issues start getting worked out, then I would get less bullish.
If you look at the February daily gold chart, you’ll clearly see that gold has created a strong uptrend starting back in the middle of November which has put it back in bullish trend. The trend is your friend, so as long as gold stay in bullish trend look for higher prices. If the issues I mentioned above don’t get resolved within the first quarter of 2019, then I would not rule out $1,400 an ounce gold.
Gold Feb ’19 Daily Chart


