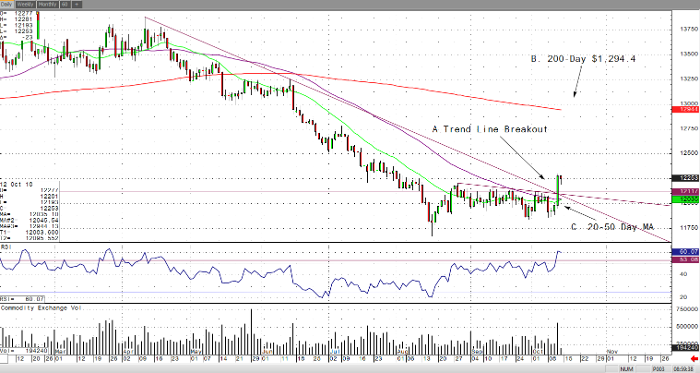
December gold has pulled back slightly from its overnight highs and the two-day strong bull rally. There appears to be a lot of anxiety in global markets due to the massive two day sell-off in U.S. equities and investors flocked into gold out of fear, which caused it to rally roughly $30 an ounce. The sell-off was mostly due to the fear of rising interest rates continuing into next year according to the Fed Chair Powell. However, the U.S. markets might gain some support by strong economic data that came out of China last night and end of the week profit taking.
If you take a quick look at the daily December gold chart, you’ll see that it broke above significant resistance levels yesterday and breaking out of a long-term bearish trend. Furthermore, gold is now above its 20 and 50-day moving averages and if it could gain some strong buying from the bulls after yesterday’s break out, then gold can rally all the way up to its 200-day moving average of $1,294.4 an ounce. All levels are highlighted below on my RJO Pro daily December gold chart.
Gold Dec ’18 Daily Chart


