In the early morning trade, February gold is currently trading at $1,249.4 which is up $6 an ounce overnight. Gold has yet again extended its rally that started back on November 13th and now trading at its highest level in over two months. Some of the key issues moving gold higher today is the sell-off in the dollar and the week jobs number this morning which might have caused some safe-haven buying or protection. Furthermore, Fed Chair Powell said that the U.S. labor market is very strong, so over the long hall, strong economic growth should be good for the metals.
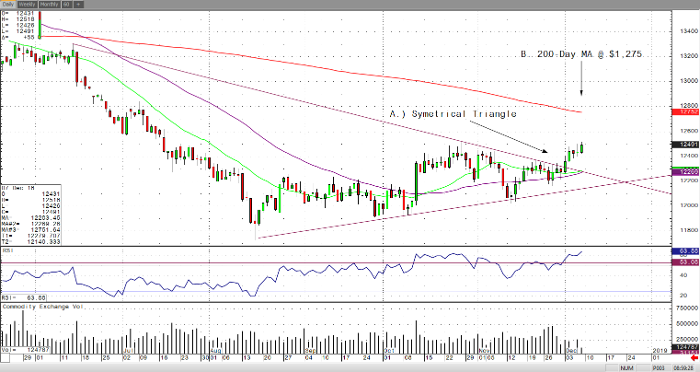
If we take a quick look at the daily February gold chart, you’ll see that it’s a very bullish chart. Earlier this week it broke out of the symmetrical triangle pattern its been trading in for the last couple of months. Moreover, it is currently trading at the high on October 18th of $1,252, so if it breaks above this level, the shiny one should enjoy a momentum rally up to it’s 200-day moving average of $1,275 an ounce or higher to the $1,300 handle. The levels I spoke about above are highlighted below on my RJO Pro daily February gold chart.
Gold Feb ’19 Daily Chart


