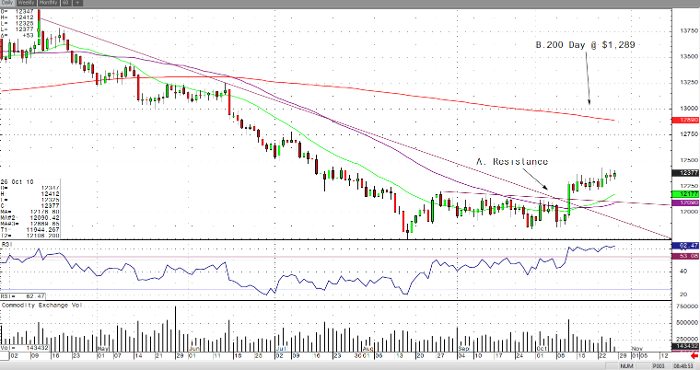
December gold is slightly up in the early morning trade, currently trading at $1,235.5 an ounce. The U.S. dollar has been on a tear over the last week and a half, while the gold market has been breaking above resistance and breaking new monthly highs. Yesterday, gold held up strongly in the wake of a decking stock market and today it’s holding up strong off this morning’s solid Q3 GDP number of 3.5%. Gold is finally looking like a market that is starting to wake up. Furthermore, gold ETFS holdings have been consistently rising since the beginning of October to 53.4 million ounces, so this might be another indicator that investors are starting to put their money on the long side of the shiny one.
If you take a quick look at the daily December gold chart, you’ll clearly see that on October 11th, gold broke above major resistance around $1,220 an ounce and has since gained roughly $20 an ounce. It has since held above the resistance and looks likes it’s prone to rally up to its 200-day moving average which lays at $1,289.0 an ounce. Furthermore, the 20 and 50-day moving average pattern would back up more upside momentum buying with the 20-day crossing above the 50-day this week. I highlighted these levels below on RJO’s Pro daily December gold chart.
Gold Dec ’18 Daily Chart


