Posted on Jun 28, 2023, 08:34 by Dave Toth
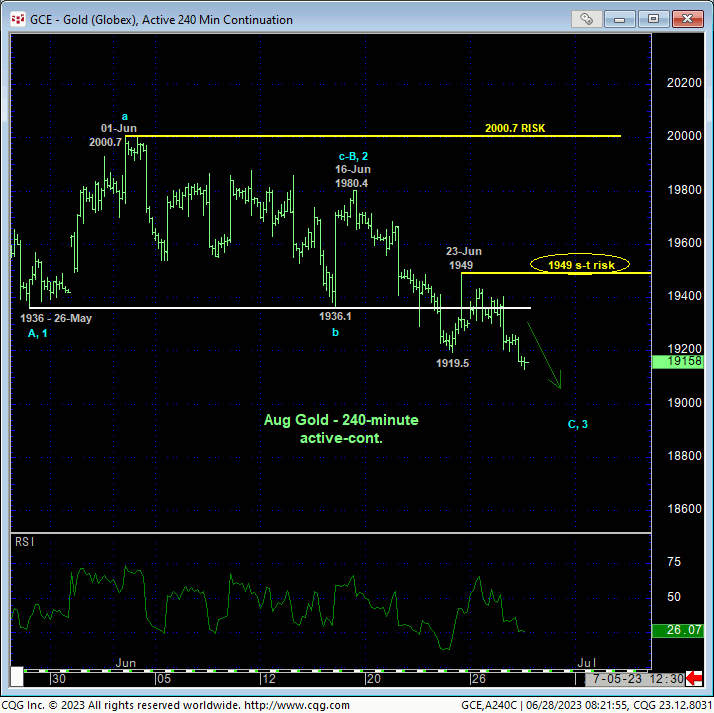
Today’s break below last week’s 1919.5 low reaffirms our longer-term bearish count introduced in 17-May’s Technical Blog and leaves new smaller- and larger-degree corrective highs in its wake at 1949.0 and 2000.7, respectively. These levels now serve as our new short- and longer-term parameters from which the risk of a still advised bearish policy and exposure can be objectively rebased and managed.


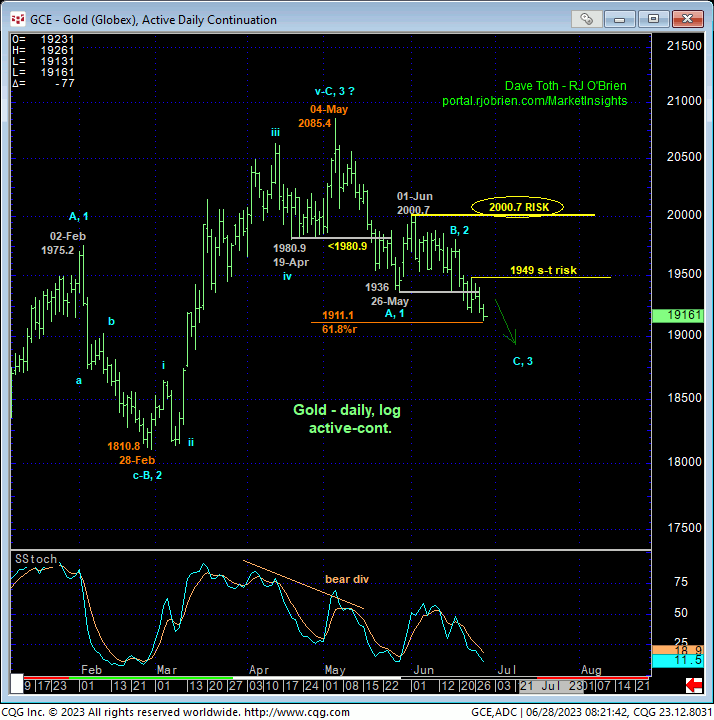
These new bear risk parameters may come in handy as the daily log chart above shows the market’s engagement of the (1911) 61.8% retrace of Feb-May’s rally from 1810.8 to 2085.4. But in the absence of an accompanying confirmed bullish divergence in momentum above a level like even 1949, no merely “derived” and so-called “technical level” will ever suffice as an objective reason to buck a clear and present downtrend.
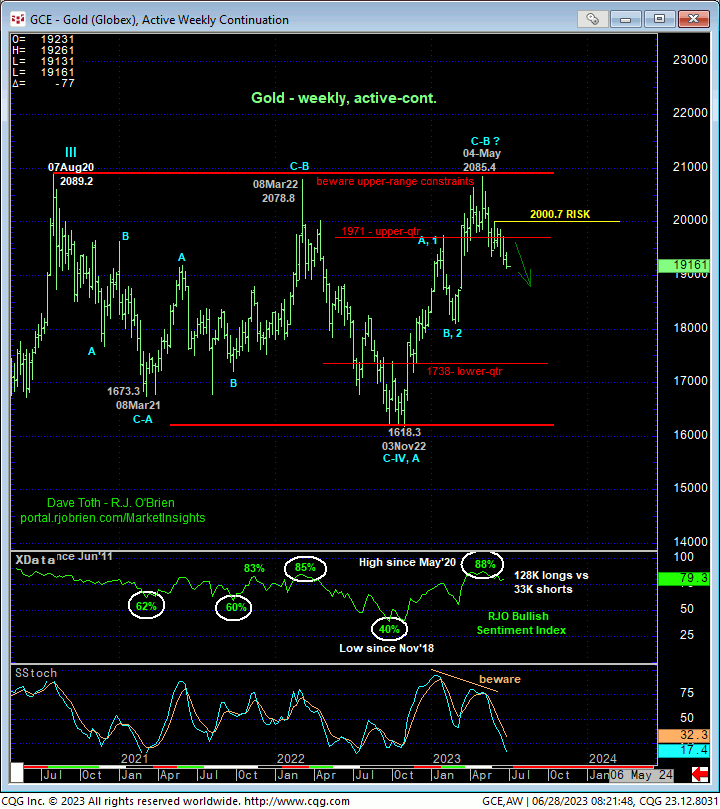
From an Elliott Wave perspective, this month’s resumed slide is either the completing C-Wave of a broader bull market correction OR the dramatic 3rd-Wave of a more protracted move south. With still-frothy (79%) levels in our RJO Bullish Sentiment Index, traders are urged not to underestimate the extent of this market’s downside vulnerability as the forced capitulation of this long-&-wrong bullish exposure could exacerbate the plunge.
On a weekly basis below, the market as clearly rejected the upper-quarter resistance of the past 3-YEAR range in which a reversion to this range’s middle-half bowels well into an 1800-handle is easily seen.
In sum, the trend remains down on all practical scales and should not surprise by its continuance or acceleration straight away with a recovery above at least 1949 and/or 2000.7 required for traders to pare or neutralize bearish exposure commensurate with their personal risk profile. In lieu of such strength, further and possibly protracted losses straight away remain expected.


