Posted on Oct 30, 2023, 06:53 by Dave Toth
DEC GOLD
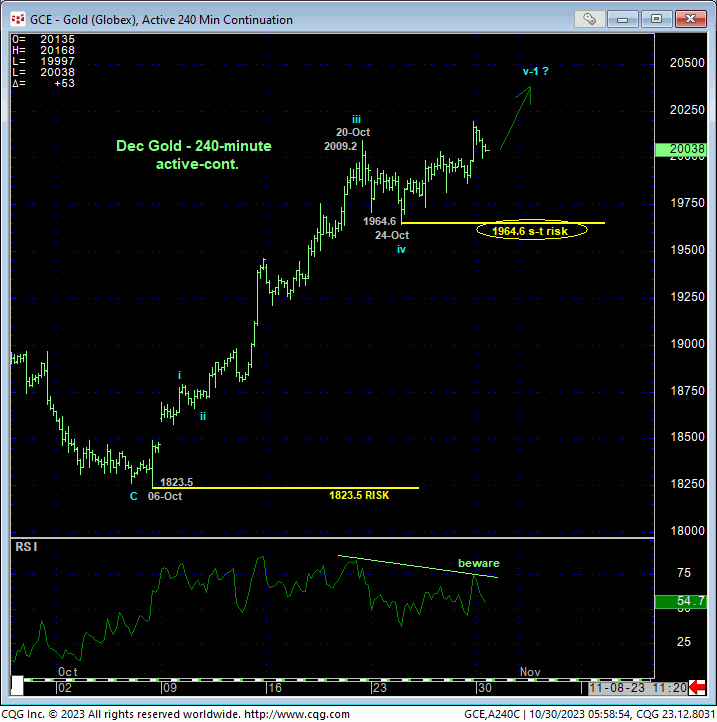
Fri’s break above 20-Oct’s 2009.2 high detailed in the 240-min chart below reaffirms this month’s impressive, impulsive uptrend and leaves 24-Oct’s 1964.6 low in its wake as the latest smaller-degree corrective low this market is now required to sustain gains above to maintain a more immediate bullish count. Its failure to do so will confirm a bearish divergence in short-term momentum, break the uptrend from 06-Oct’s 1823.5 low and expose at least an interim correction of this rally of indeterminable scope. Per such and especially “up here” at 2000+ levels that the market has rejected multiple times over the past three years, this 1964.6 low is considered our new short-term but key parameter from which the risk of a bullish policy and exposure can be objectively rebased and managed.
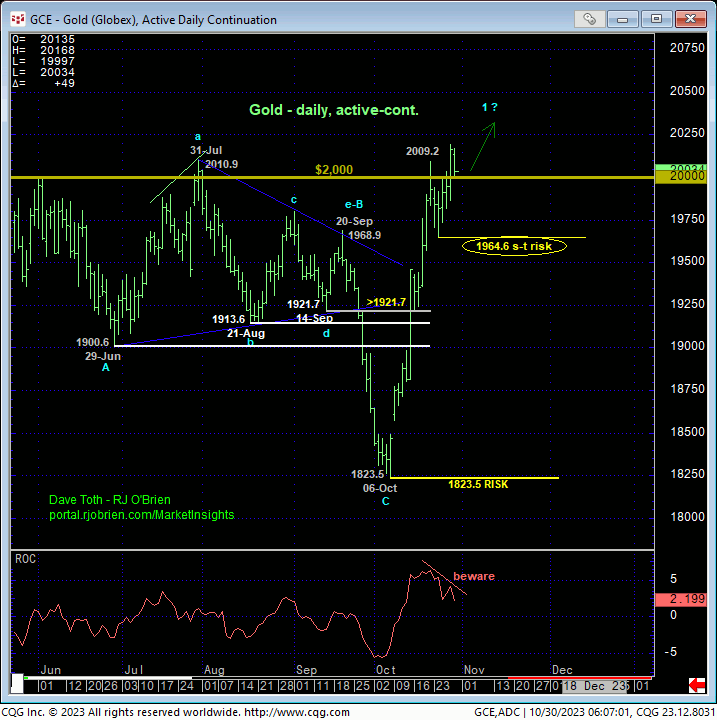
The daily chart above shows this month’s impressive, impulsive uptrend as well as the nicely developing POTENTIAL for a bearish divergence in momentum. A failure below 1964.6 is required to CONFIRM this divergence to the point of non-bullish action like long-covers as the extent and uninterrupted nature of this month’s rally left nothing in the way of former battlegrounds below 1964.6 that we might look to as a support candidate shy of 06-Oct’s 1823.5 low. This does not mean we’d look for a return to 1823-area prices if the market failed below 1964.6. But it certainly does mean that unless one is of a long-term risk profile and is willing to acknowledge and accept bull risk to 1823.5, the only other remaining OBJECTIVE bull risk parameter is 1964.6.
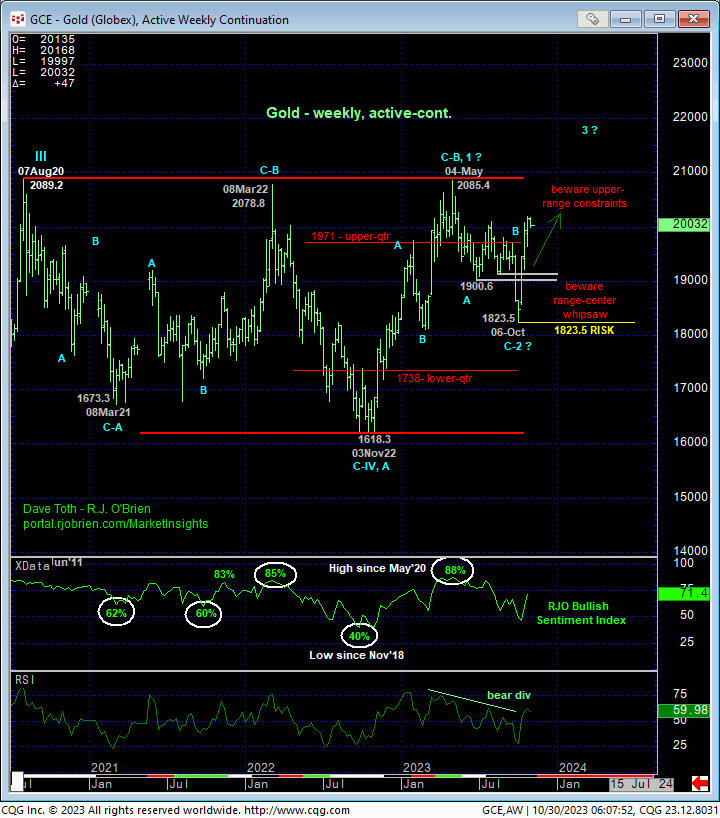
On a broader weekly scale, the chart below clearly shows May-Oct’s sell-off attempt as only a 3-wave affair. Left unaltered by a relapse below 1823.5, this 3-wave setback is considered a corrective/consolidative event that warns of an eventual resumption of Nov’22 – May’23’s uptrend that preceded it to new highs above 2085 and then probably new all-time highs above Aug’20’s 2089 high. The interim challenge to such a longer-term bullish count is the obvious resistance from the upper-quarter of the lateral trading range that has dominated this market for the past THREE YEARS. A short-term relapse below 1964/6 will not negate such a longer-term bullish count. But it would defer or threaten it enough for shorter-term traders with tighter risk profiles to neutralize bullish exposure in order the circumvent the depths unknown of yet another intra-range setback.
This raises the not uncommon technical and trading matter of SCALE and objective risk assumption. Per our recommendation, it is quite OK and appropriate to bias WITH the clear and present uptrend with a bullish policy and exposure. But maintaining a bullish policy “up here” at the upper recesses of the 3-YEAR range is a bet on its continuation straight away and bust out to new all-time highs above 2089. Again, a failure below 1964.6 will not negate this longer-term bullish count. Indeed, a commensurately larger-degree failure below 1823.5 is required for this. but since there are NO levels of any technical merit between 1964.6 and 1823.5, bulls who do not take defensive measures on a failure below 1964.6 are identifying themselves as long-term players and accepting risk down to 1823.5. And the additional risk of even a minimum 1-lot position between 1964.6 and 1823.5 is over $14,000.
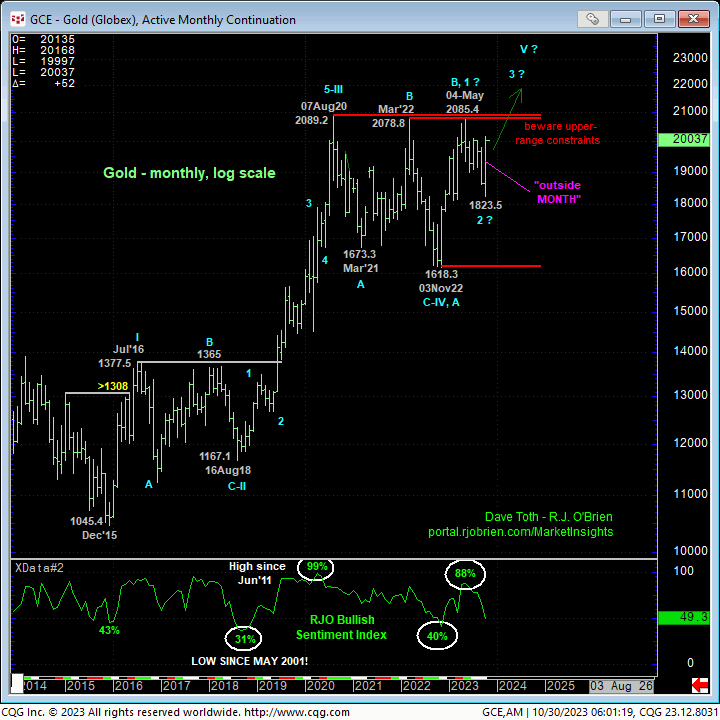
Stepping back even further, the monthly log chart of gold shows the mere lateral and consolidative nature of the past three years’ price action that warns of an eventual resumption of the secular bull market that preceded it. Additionally, the market is working on an “outside MONTH up” this month (lower low, higher high and higher close than Sep’s range and close) that would seem to reinforce a longer-term bullish count. BUT IF such a longer-term bullish count is for the here and now, especially “up here” at the upper recesses of the 3-year range, it is vital for the bull to BEHAVE LIKE ONE by sustaining trendy, impulsive and increasingly obvious price action higher. A failure below 1964.6 is not of a scale to negate this long-term bullish count, but it WOULD be of a sufficient scale to defer the bull in favor of an interim correction lower of indeterminable and potentially significant scope that would be outside the bounds of shorter-term traders’ risk profiles.
These issues considered, a bullish policy and exposure remain advised with a failure below 1964.6 required to defer or threaten this call enough for all traders to move to a neutral/sideline position to circumvent the depths unknown of an interim correction or reversal lower. In lieu of such sub-1964.6 weakness, the trend is up on all practical scales and should not surprise by its continuance or acceleration straight away, including a run to new all-time highs above 2089.
JAN PLATINUM
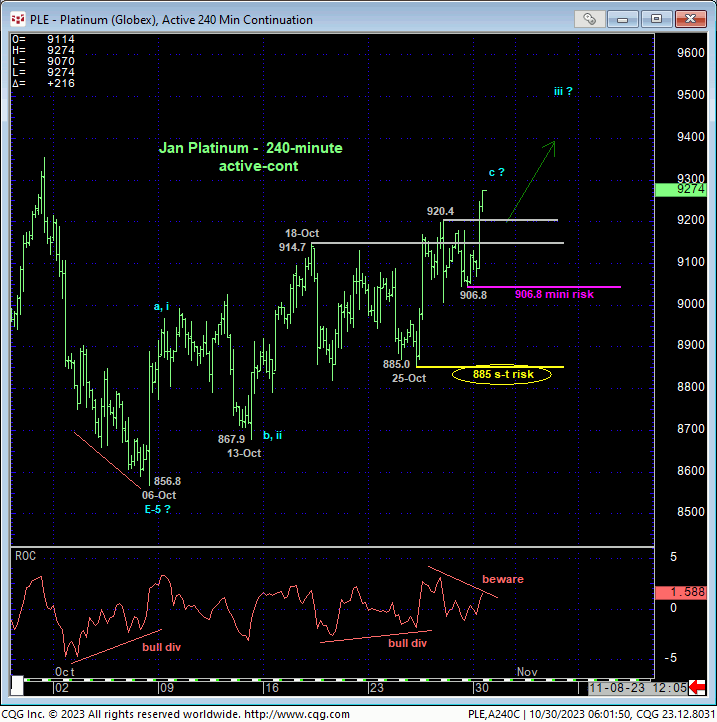
Overnight’s break above last week’s 920.4 high reaffirms the developing recovery from 06-Oct’s 856.8 low and leaves smaller-degree corrective lows in its wake at 906.8 and 885.0. These levels serve as our new mini and short-term parameters from which the risk of non-bearish decisions like short-covers and cautious bullish punts can be objectively rebased and managed by shorter-term traders.
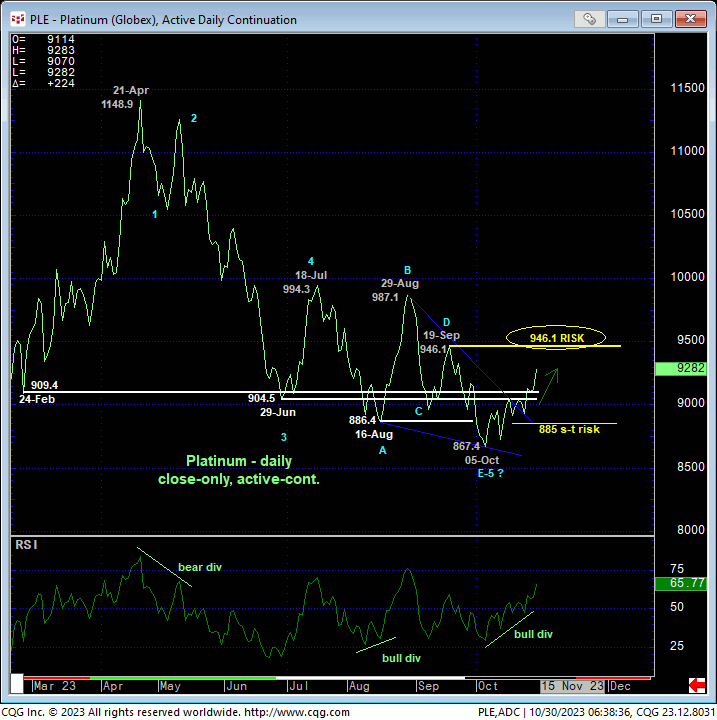
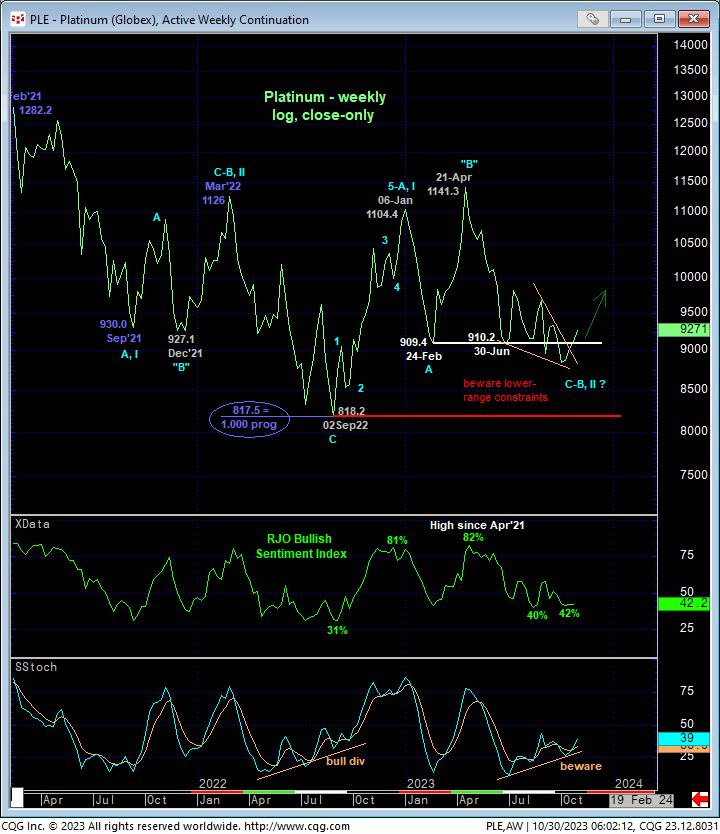
What’s potentially crucial and opportunistic about these smaller-degree corrective low and very short-term bull risk parameters is that they’re arguably subsets within a base/reversal count that could be major in scope. In 17-Oct’s Technical Webcast we introduced a base/reversal count predicated on:
- the market’s recent proximity to the lower-quarter of the past year’s range amidst
- clearly waning downside momentum
- the return to historically bearish sentiment levels, and
- an arguably complete wave sequence down from 21-Apr’s 1148 high daily close.
Today’s continued recovery shows the market’s inability thus far to sustain late-Sep/early-Oct losses below a TON of former support-turned-resistance that dates from late-Feb around the 910-to-886-range. A recovery above 19-Sep’s 946.1 larger-degree corrective high close remains require to confirm a bullish divergence in WEEKLY momentum and contribute to this major base/reversal count. In this regard, that 946.1 high remains intact as a key longer-term bear risk parameter. But until and unless this market fails below at least 906.8 and especially 885.0, we believe odds are improving for a broader base/reversal count.
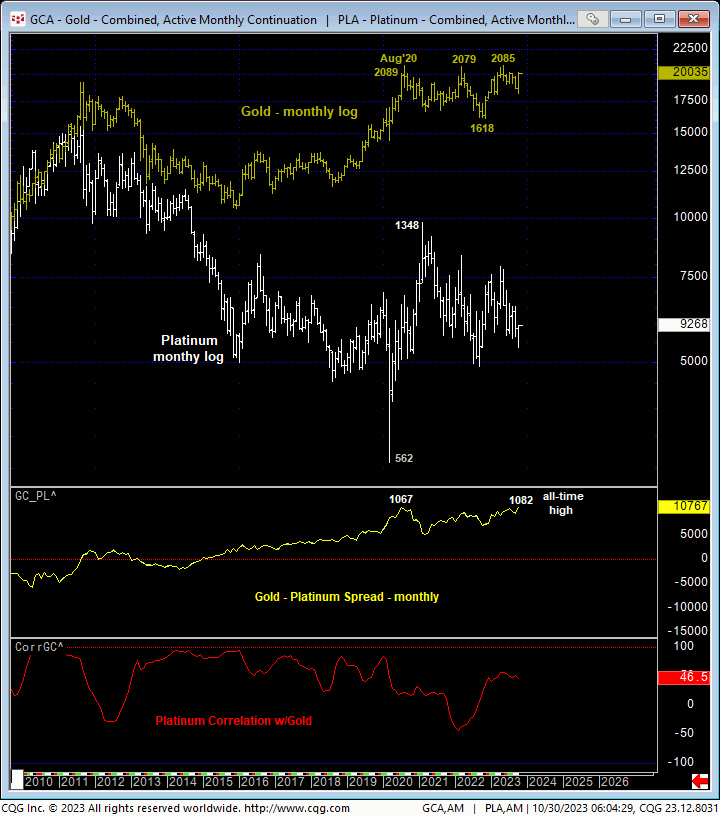
Lastly, the monthly chart below compares platinum prices to gold and their correlation. Currently, the spread between these two metals stands at an all-time high of $1,082. It’s not hard to envision a scenario in which this spread may narrow, and potentially sharply, if the gold market remains on its bullish tangent to new all-time highs, contributing to the risk/reward merits of a bullish stance in platinum.
These issues considered, a cautious bullish policy and exposure are advised in platinum with a failure below 906.8 and/or 885.0 deferring or threatening this call enough to warrant defensive measures. In lieu of such weakness, further and possibly accelerated gains straight away should not surprise.
