DEC GOLD
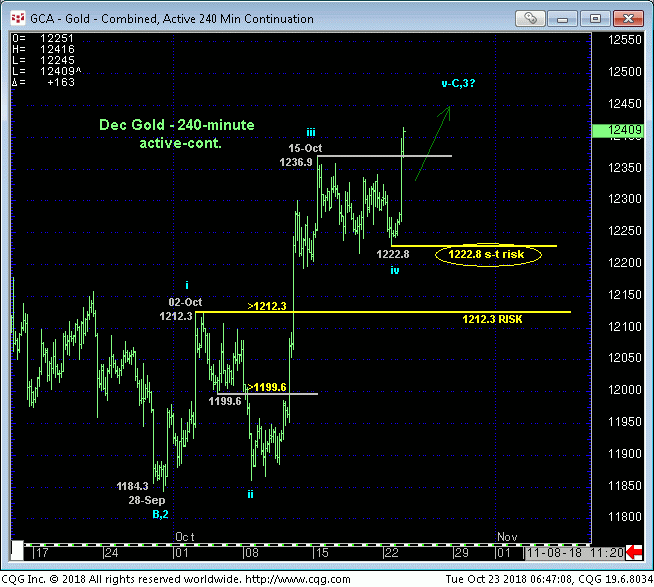
Today’s resumed rally above last week’s 1236.9 high leaves yesterday’s 1222.8 low in its wake as the latest smaller-degree corrective low the market is now minimally required to fail below to threaten the uptrend and our broader base/reversal count. In this regard that 1222.8 low becomes our new short-term risk parameter from which a continued bullish policy and exposure can be objectively rebased by shorter-term traders with tight risk profiles. Former 1235-area resistance is expected to hold as new near-term support.
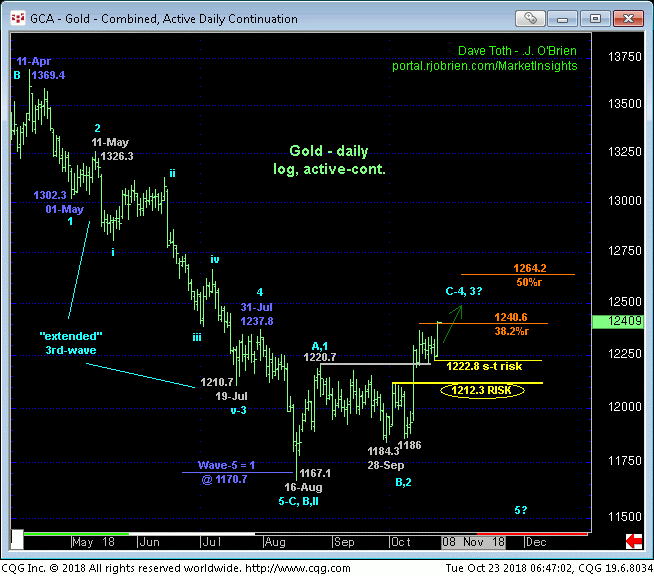
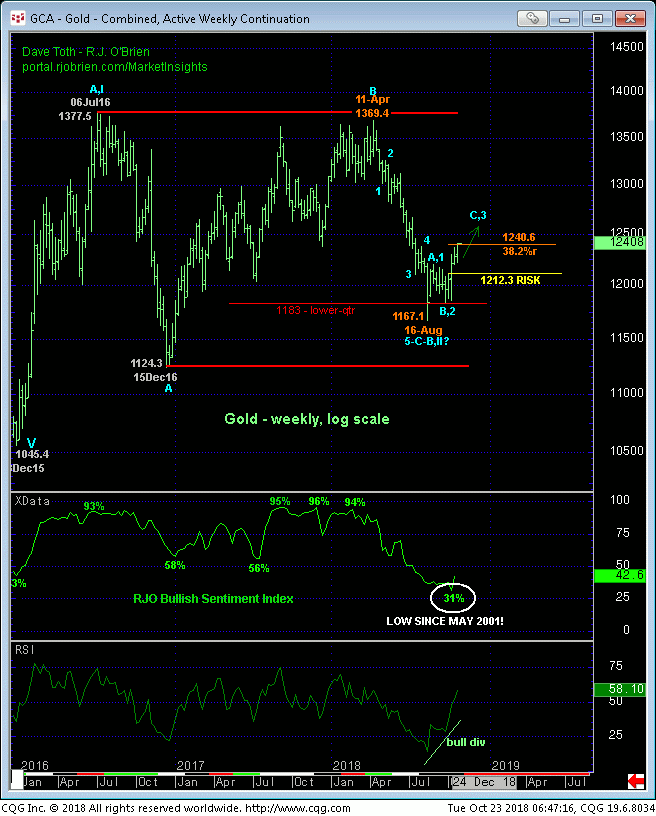
To this point the recovery from 16-Aug’s 1167.1 low is only a 3-wave affair and cannot be fully ignored as a possible correction within a still-major bear market. BUT a failure below 28-Sep’s 1184.3 is required to confirm that alternate count. Until and unless such weakness is shown, there’s no way to know the rally from 1184.3 isn’t the dramatic 3rd-Wave of a major reversal higher that’s may not be poised to launch. The:
- bullish divergence in WEEKLY momentum from
- the lower-quarter of the past couple years’ range amidst
- historically bearish sentiment levels
on which our major base/reversal count is predicated identifies a unique and compelling condition that warned of and accompanied major base/reversal environments in the past. Indeed, the recent 31% reading in our proprietary RJO Bullish Sentiment Index of the hot Managed Money positions reportable to the CFTC was the lowest since May of 2001! Such historic bearishness warns of potentially tremendous upside vulnerability that today’s poke to a new 2-month high arguably reinforces.
These issues considered, a full and aggressive bullish policy and exposure remain advised with a failure below 1222.8 required for shorter-term traders to step aside and longer-term players to pare exposure to more conservative levels. Subsequent weakness below 02-Oct’s 1212.3 (suspected minor 1st-Wave) high and our longer-term risk parameter is required for longer-term players to neutralize exposure altogether as that weakness could resurrect this year’s broader bear. In lieu of such weakness further and possibly accelerated gains are anticipated straight away.
DEC SILVER
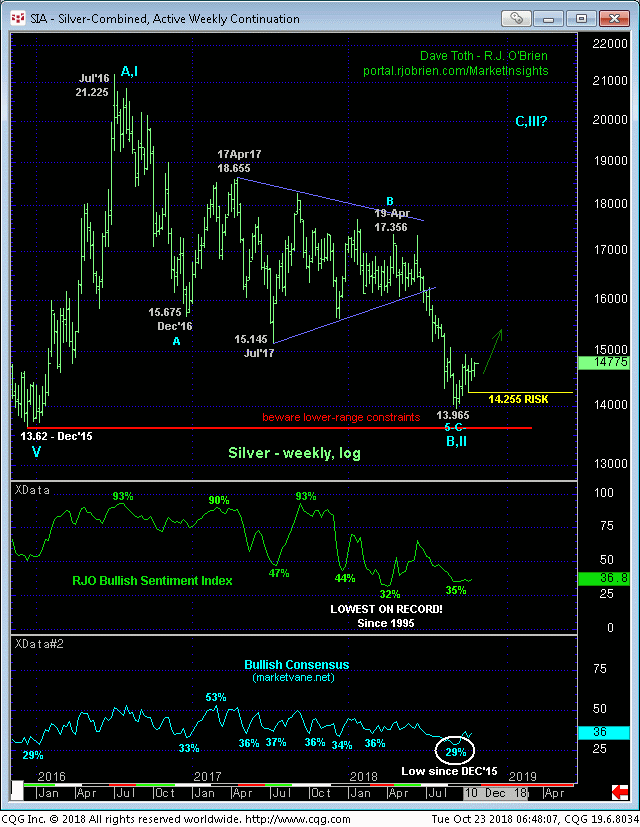
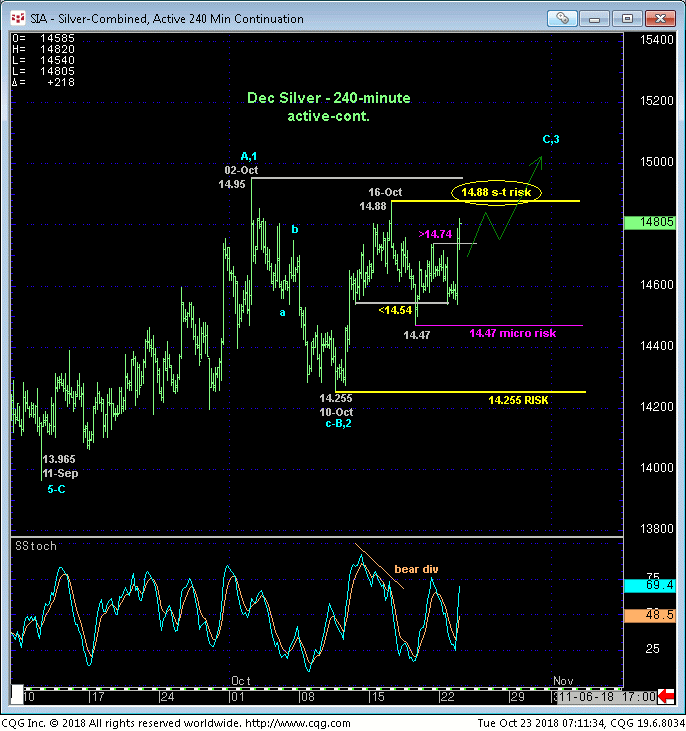
While silver is very likely to take the same route as gold, last Thur’s bearish divergence in short-term momentum below 12-Oct’s 14.54 minor corrective low leaves 16-Oct’s 14.88 high in its wake as a short-term risk parameter the market must now hurdle to mitigate that mo failure, render last week’s setback a 3-wave and thus corrective affair and resurrect our broader base/reversal count. This said, this morning’s recovery above Fri’s 14.74 initial counter-trend high exposes at least the short-term trend as up and defines Thur’s 14.47 low as one of developing importance and arguably the end or lower boundary of a minor, intra-range correction ahead of a resumption of mid-Oct’s 14.25 – 14.88 uptrend that preceded it. In effect, the market has identified 14.88 and 14.47 as short-term but key directional triggers heading forward.
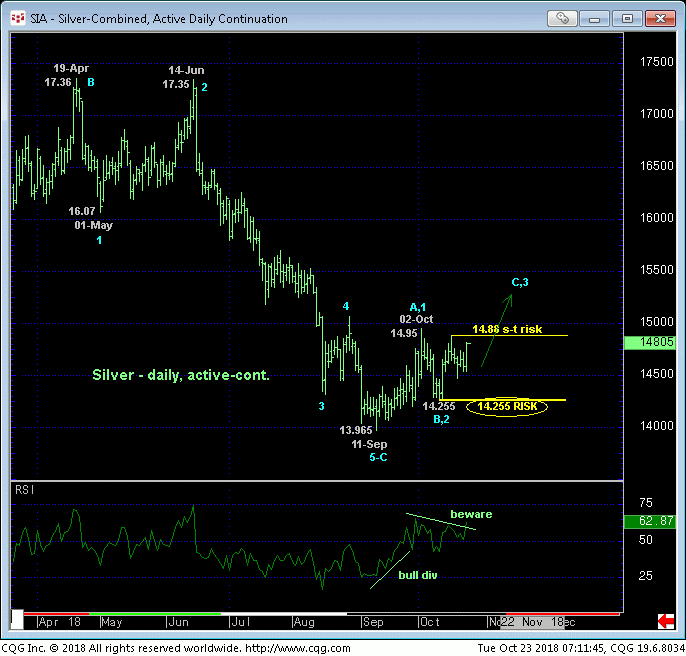
From a longer-term perspective the same base/reversal factors on which our gold base/reversal count is predicated are present in silver. The:
- market’s proximity to the extreme lower recesses of the past three years’ range
- historically bearish sentiment
- bullish divergence in momentum and
- arguably complete 5-wave Elliott sequence down from 19-Apr’s 17.36 high
conspire to warn of a base/reversal environment from 11-Sep’s 13.965 low that may be major in scope. Weakness below 10-Oct’s 14.255 larger-degree corrective low and key risk parameter remains minimally required to threaten this call enough for long-term players to move to the sidelines.
In sum, a bullish policy remains advised for long-term players with a failure below 14.255 required to negate this call and warrant its cover. Shorter-term traders whipsawed out of bullish exposure by Thur’s bearish divergence in short-term mo are advised to re-establish bullish exposure on a breakout above 14.88 with a subsequent failure below 14.47 required to negate this call and warrant its cover. A breakout above 14.88 could/should expose potentially steep gains.
