Posted on Feb 15, 2023, 07:35 by Dave Toth
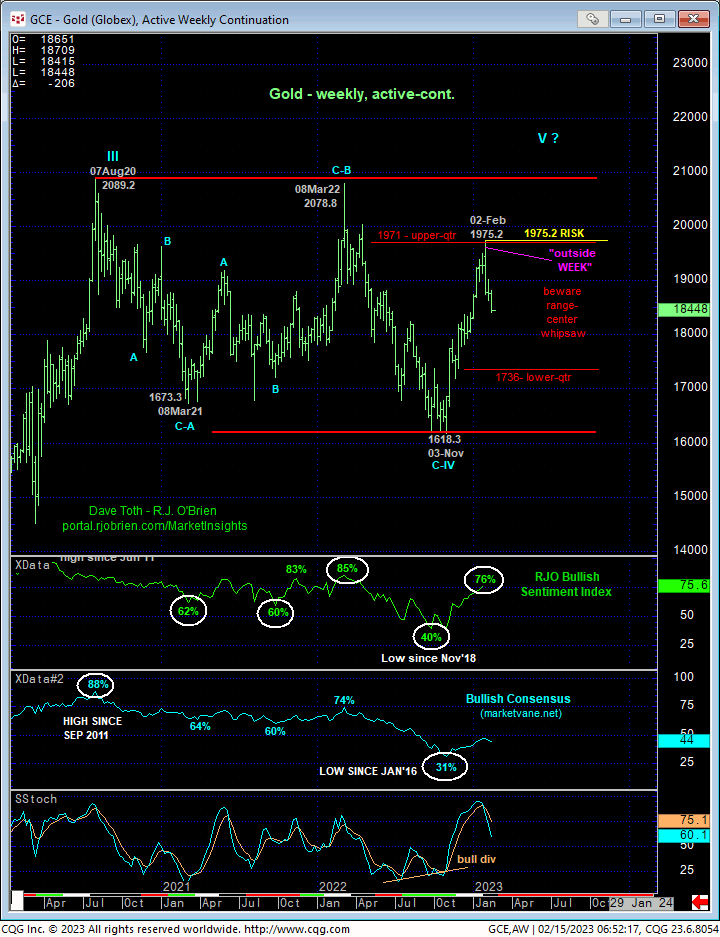
This week’s continued erosion reinforces our peak/correction/reversal count introduced in 03-Feb’s Technical Blog. This continued weakness not only leaves last Thur’s 1902.3 high in its wake as the latest smaller-degree corrective high this market is now minimally required to recoup to mitigate a steeper decline, but also looks to be identifying 02-Feb’s 1975.2 high as a more considerable one ahead of a more protracted rebuttal to Nov-Feb’s entire 1618.3 – 1975.2 rally. Per such, 1902.3 and 1975.2 are considered our new short- and long-term risk parameters from which short- and longer-term traders can objectively base non-bullish decisions like long-covers and bearish punts.
Former 1875-area support is considered new near-term resistance ahead of further and possibly protracted losses.


On a broader scale and as this market approached the upper-quarter of the past couple years’ lateral range that we acknowledged as a key resistance candidate, we found it challenging to “count” the impressive rally from 03Nov22’s 1618.3 low from a geeky Elliott perspective. Dec’22’s lateral chop/consolidation just didn’t seem to fit following the bull’s resumption after mid-to-late-Nov’s corrective setback.
In the daily log chart above and only with the hindsight of the extent of this month’s relapse, we find it interesting that the resumed rally from 15-Dec’s 1782 low came within 2-bucks of the (1973.1) 1.000 progression of Nov’s initial 1618.3 – 1791.8 rally. This presents the prospect that the price action from 15-Nov’s 1791.8 high to 15-Dec’s 1782 low is a “running” (i.e., upwardly-skewed) B- or 2nd-Wave correction. This count also would suggest that Nov-Feb’s entire rally is only a 3-wave event thus far. With the market’s return to deep, deep within the middle-half bowels of the past 30-MONTH lateral range shown in the weekly chart below where the odds of aimless whipsaw risk are approached as higher, a more challenging and volatile trading environment would not surprise in the period ahead.
The “outside WEEK down” the week of 02-Feb’s 1975.2 high coupled with the return to historically frothy levels in our RJO Bullish Sentiment Index AND the market’s clear rejection of the upper-quarter of its 30-month range all contribute to a peak/correction/reversal threat that could be protracted is scope. Additionally, the gold market maintains a highly positive correlation with currencies such as the euro and yen. And as we’ve discussed in this month’s currency blogs, broader peak/reversal threats are developing nicely.
These issues considered, a bearish policy remains advised for shorter-term traders with a recovery above 1902.3 required to threaten this call enough to warrant its cover. Furthermore, longer-term commercial players are advised to jettison any remaining bullish exposure and move to a cautious bearish stance at-the-market (1842) with a recovery above 1902.3 required to move to a neutral/sideline position. In lieu of a recovery above at least 1902.3 and preferably 1975.2, lateral-to-lower prices are anticipated for the foreseeable future.


