DEC SILVER
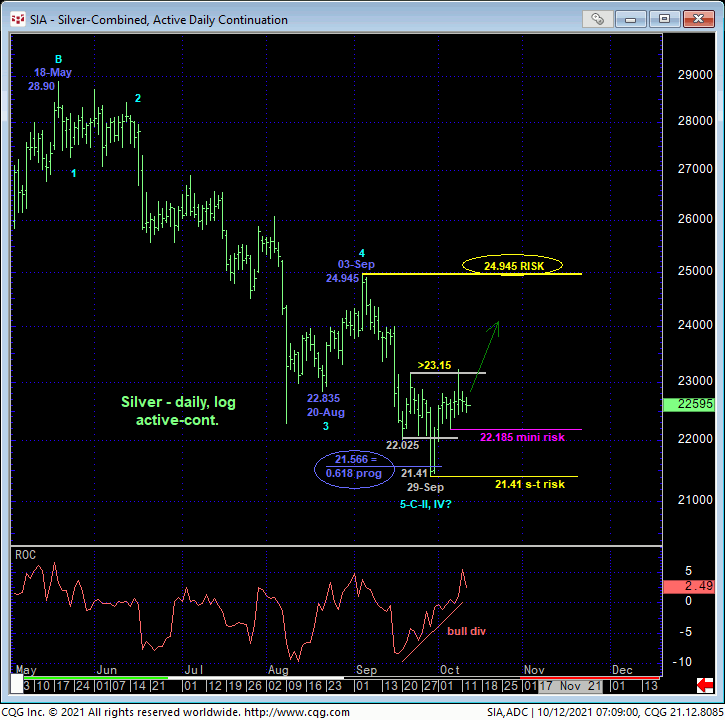
In 01-Oct’s Technical Blog, we discussed that day’s bullish divergence in admittedly very, very short-term momentum above a minor corrective high from 29-Sep at 22.565. Last week’s mere lateral, corrective chop and spike above 04-Oct’s 22.805 initial counter-trend high reinforces this early base/reversal-threat behavior and leaves TWO market-defined lows and support at 22.185 and 21.41 that can be used as shorter-term risk parameters from which non-bearish decisions like short-covers and cautious bullish punts can be objectively based and managed.
While, on a broader scale, the confirmed bullish divergence in daily momentum below only allows us to conclude the end of the downtrend from 03-Sep’s 24.945 larger-degree corrective high and key long-term bear risk parameter, the prospect that 29-Sep’s 21.41 low COMPLETED a textbook 5-wave Elliott sequence down from 18-May’s 28.90 high is hard to ignore and would certainly contribute to a broader base/reversal threat. Indeed, a recovery above 24.945 remains required to confirm a complete 5-wave count down from 28.90 to 21.41. But with the market having identified some more reliable lows and support from which non-bearish decisions can be objectively based and managed, the favorable risk/reward merits of any non-bearish decisions “down here” are compelling, especially given ancillary longer-term evidence discussed below.
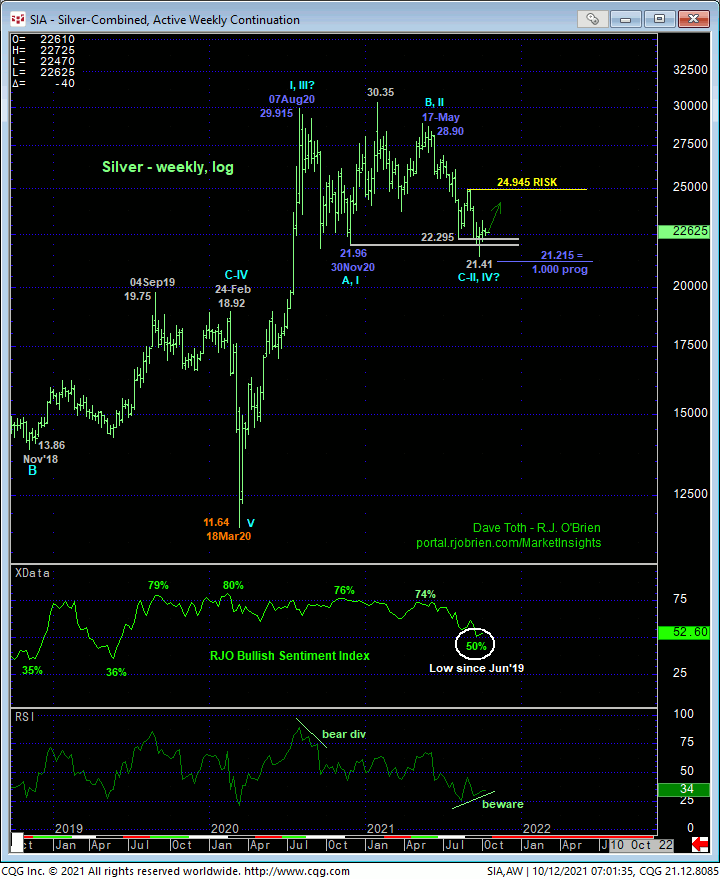
The weekly log scale chart below shows late-Sep’s break below Nov’20’s 21.96 key low that exposes the very long-term trend as down. Until negated by a confirmed bullish divergence in WEEKLY momentum with a recovery above 24.945, the decline from 17-May’s 28.90 high could be the dramatic 3rd-Wave of a massive reversal of 2020’s 11.64 – 29.915 rally.
BUT thus far, the market has failed to sustain sub-21.96 losses. This has resulted in the developing POTENTIAL for a bullish divergence in weekly momentum. Combined with the lowest (50%) reading in the Bullish Consensus (marketvane.net) and what is thus far only a 3-wave decline from Aug’20’s 29.915 high, it’s easy to see the super-bullish count calling all of the price action from last year’s 29.915 high a major correction/consolidation ahead of the eventual resumption of the secular bull trend to new highs above 29.915. IF this long-term bullish count is what the market has in mind, then the admittedly short-term basing behavior the market has exhibited the past couple weeks is precisely what we would expect as the very early underpinnings of such a larger-degree base/reversal count.
But now the onus is on the bull to BEHAVE LIKE ONE with sustained, trendy, impulsive price action higher. The bull needs to take out Fri’s 23.22 spike high and continue upward from there, eventually breaking 03-Sep’s key 24.945 larger-degree corrective high and key long-term bear risk parameter. A relapse below last Wed’s 22.185 minor low won’t negate this bullish count, but it wouldn’t help. And of course, a relapse below 21.41 will negate it, reinstate the bear and expose potentially sharp losses thereafter.
These issues considered, a cautious bearish policy remains advised for long-term institutional players with a recovery above 23.22 required to neutralize remaining exposure and start the migration to a bullish policy. Shorter-term traders are advised to maintain a neutral/sideline policy for the time being ahead of a better corrective retest of late-Sep’s 21.41 low, the survival of which could present an acute risk/reward buying opportunity.
DEC GOLD
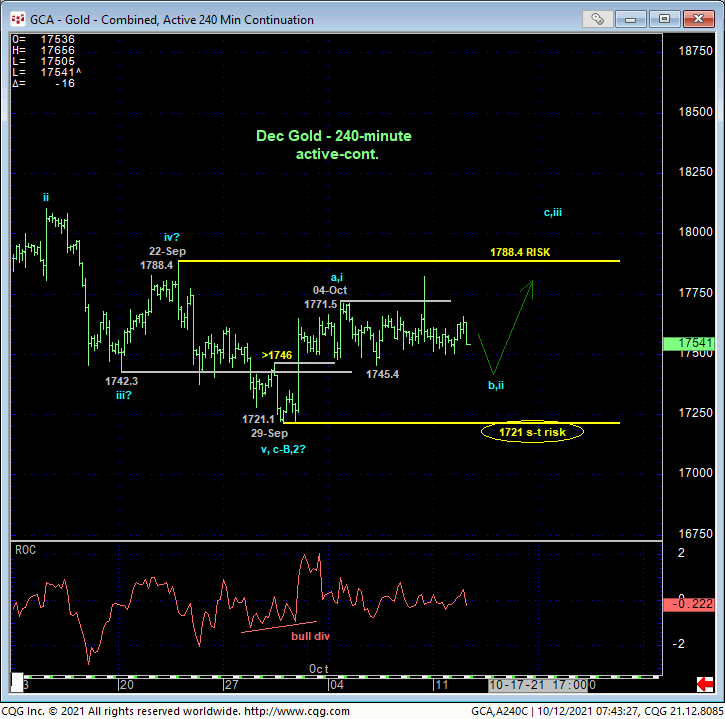
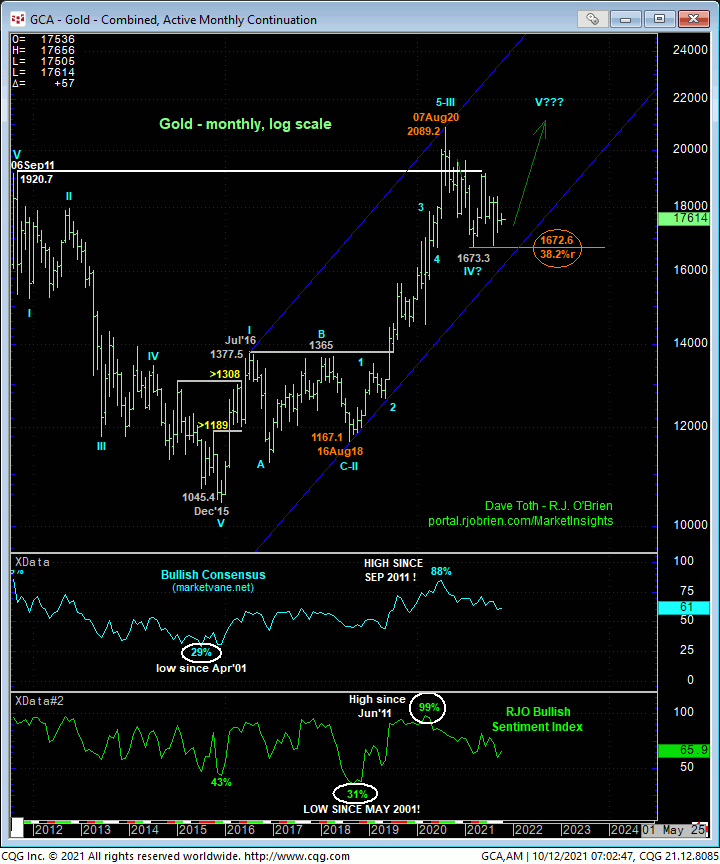
The technical construct in gold is almost identical to that described above in silver with the 240-min chart above showing 29-Sep’s 1721.1 low as a short-term risk parameter from which non-bearish decisions can be objectively based and managed and 22-Sep’s 1788.4 larger-degree corrective high as the level the market needs to recoup to confirm a bullish divergence in DAILY momentum needed to break at least Sep’s downtrend. Such 1788.4+ strength (or a close above 1778.8) would contribute to a base/reversal process from the extreme lower recesses of the past YEAR’S range that would reinforce a major bullish count calling all the price action from last year’s high a corrective/consolidative affair within the secular bull trend.
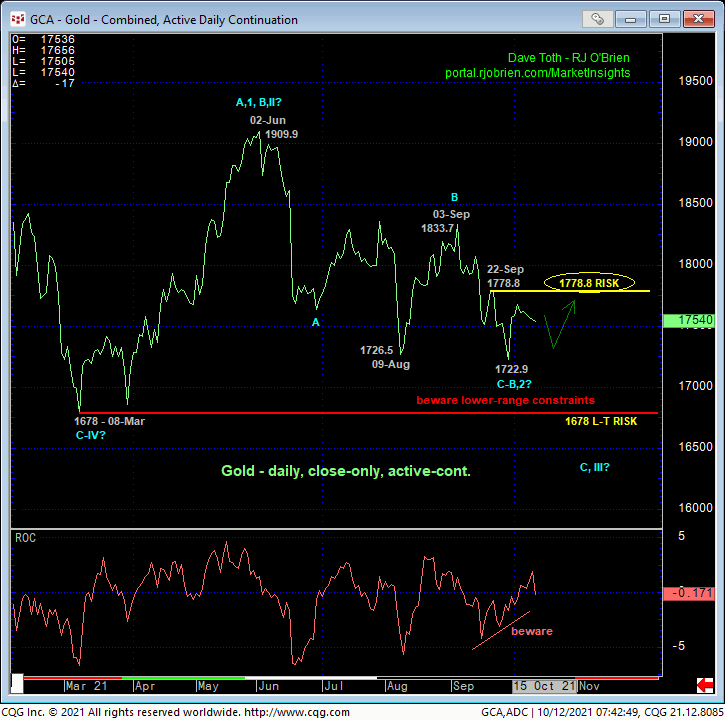
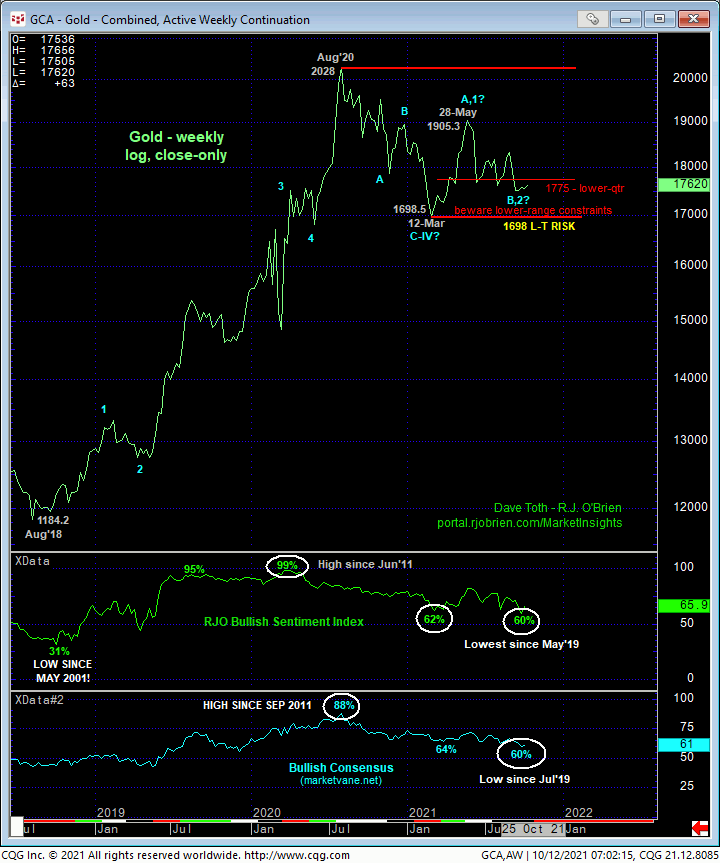
Such a long-term bull-market correction count is easier to see in the weekly log close-only chart above and monthly log chart below. Historically low levels of market sentiment and the market’s proximity to the extreme lower recesses of the past YEAR’S range would seem to contribute to this bullish count. But as with silver, if this is the case, the bull needs to start BEHAVING LIKE ONE with trendy, impulsive behavior to the upside above levels like Fri’s 1782.4 spike high and 22-Sep’s 1788.4 corrective high and key risk parameter. A relapse below 1721 will negate this specific call and expose a run at 08-Mar’s key 1678 low close and support, the break of which could expose steep losses thereafter.
These issues considered, shorter-term traders have been advised to move to a neutral/sideline position and to be watchful for proof of labored, 3-wave corrective behavior on a subsequent setback attempt that stalls at a level above 1720. If these conditions are met, a favorable risk/reward buy will be presented. Longer-term institutional players are advised to pare bearish exposure to more conservative levels and jettison remaining exposure on a recovery above 1788.4 that could produce protracted gains thereafter. In effect, we believe this market has identified 1721 and 1788.4 as the key directional flexion points heading forward.