APR GOLD
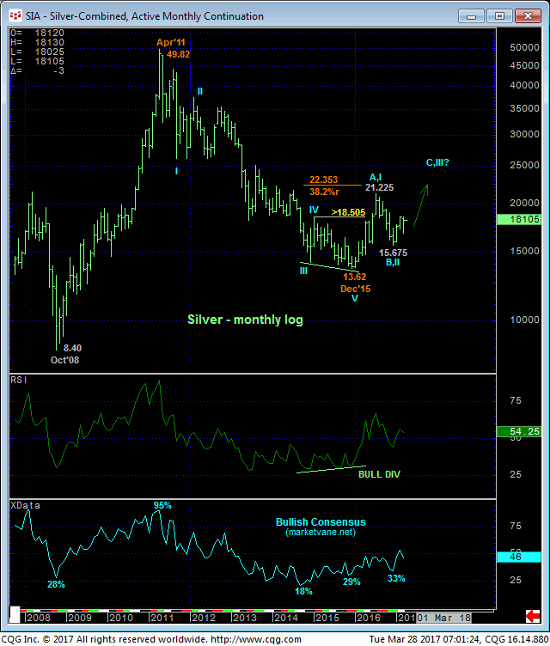
If there’s a place and time for a market to be vulnerable it’s from the extreme upper recesses of a range. The 240-min chart below shows the past couple weeks’ impressive recovery that is now pressuring 27-Feb’s key 1264.9 high and resistance amidst the developing POTENTIAL for a bearish divergence in momentum. As a direct result of yesterday’s continued rally above last week’s 1253.3 high however, the market has identified Fri’s 1240.7 low as the latest smaller-degree corrective low and THE level the market is now required to fail below to CONFIRM a bearish divergence in momentum to the point of non-bullish action like long-covers and cautious bearish punts. In this regard 1240.7 becomes our new short-term risk parameter to a still-advised bullish policy. Until and unless the market fails below 1240.7 specifically, AT LEAST the intermediate-term trend is up and should not surprise by its continuance or acceleration, a continuance that would only take a little bit more to break 27-Feb’s pivotal 1264.9 high and reinstate the LONGER-TERM uptrend.
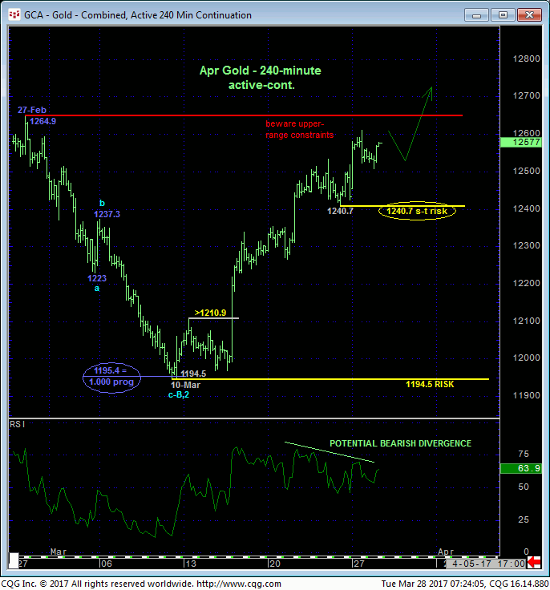
The daily chart above shows the pertinence of 27-Feb’s 1264.9 high, the break of which will reinstate the longer-term uptrend from 15Dec16’s 1124.3 low and possibly what we believe is a new major bull market. The extent and impulsiveness of the recovery from 10-Mar’s 1194.5 low and exact 50% retrace of Dec-Feb’s 1124.3 – 1264.9 rally exposes that 1194.5 low as the end or lower boundary of a suspected correction of Dec-Feb’s rally ahead of its eventual resumption. In this longer-term regard 1194.5 is considered our new long-term risk parameter to a resumed bullish policy.
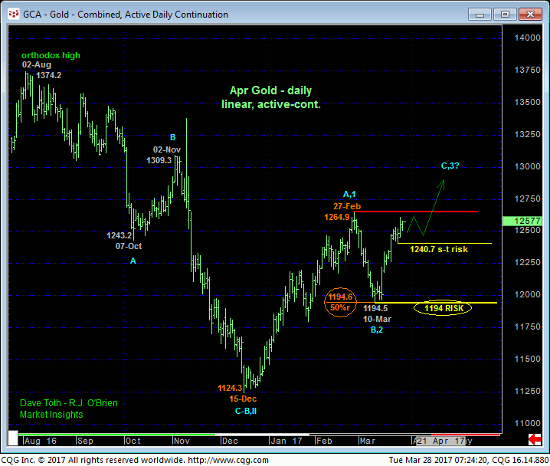
The weekly log scale chart below shows the extent of this year’s recovery that we believe defines Dec’16’s 1124.3 low as the END of a major B- or 2nd-Wave correction within an even bigger BASE/reversal-threat environment from Dec’15’s 1045.4 low that warns of a major correction or reversal of the entire 4-YEAR bear market from Sep’11’s 1920 all-time high to that Dec’15 low. If correct, this count MINIMALLY calls for a resumption of early-2016’s initial counter-trend rally to eventual new highs potentially well above last year’s 1377 high. Such a rally could be exposed on further proof of strength above 27-Feb’s 1264.9 high that now is only a stone’s throw away.
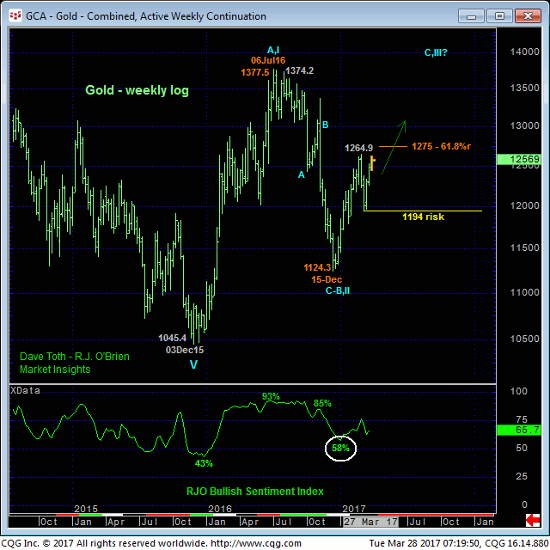
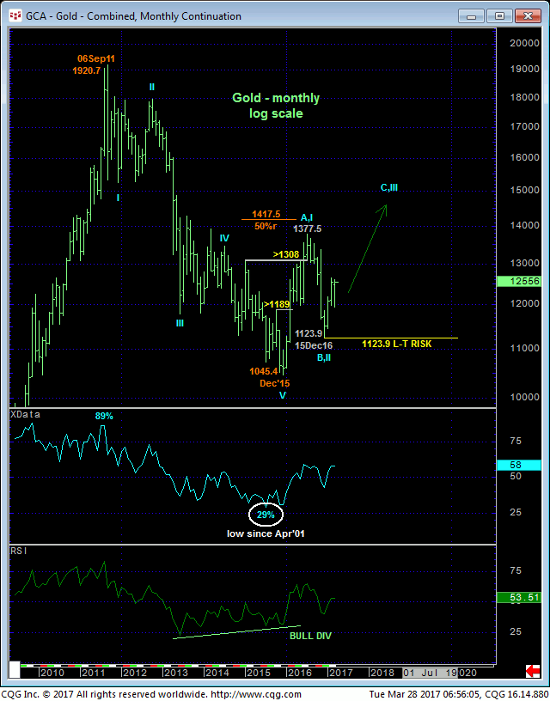
The monthly log scale chart below shows the technical FACTS that warn of a major base/reversal environment. these facts include:
- a confirmed bullish divergence in momentum that broke the 4-year bear market
- a complete/textbook 5-wave Elliott sequence down from 2011 to 2015
- historically bearish levels in the Bullish Consensus (marketvane.net) that hadn’t been seen in 14 YEARS.
These issues considered, a bullish policy and exposure are advised for both short- and longer-term traders with near-term weakness below 1240.7 deferring a bullish count until after another intra-1265 – 1195-range setback and subsequent larger-degree weakness below 1194 negating the call altogether. In lieu of such weakness further and possibly accelerated gains are expected, especially if/when the market breaks 27-Feb’s key 1264.9 high.
MAY SILVER
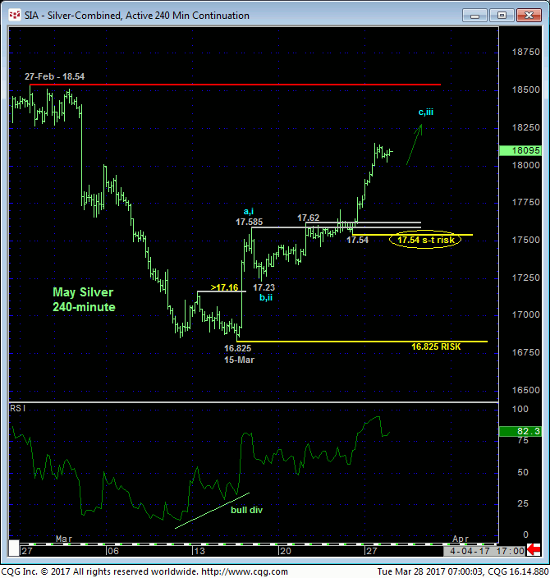
While the silver market is a little further away from its analogous 27-Feb high of 18.54, the technical construct and expectations for it are virtually identical to those detailed above in gold with Fri’s 17.54 low and 15-Mar’s 16.825 low considered the latest smaller- and larger-degree corrective lows and new short- and longer-term risk parameters to a bullish policy. Former 17.62-to-17.58-area resistance is considered new near-term support ahead of further and possibly accelerated gains.
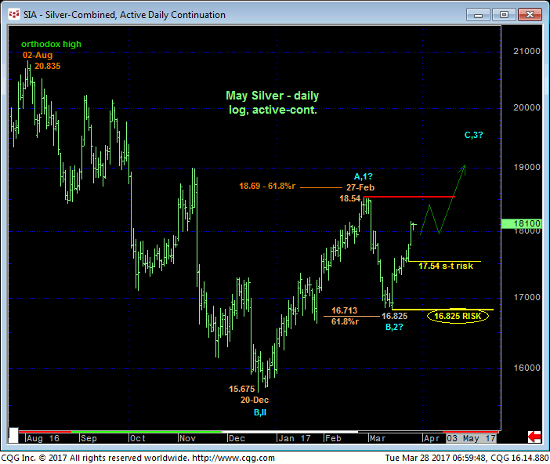
The daily log scale chart above shows the pertinence of 27-Feb’s 18.54 high, the break of which is obviously required to resurrect not only Dec-Feb’s rally, but a base/reversal process that arguably dates from Nov’14’s 15.04 low shown in the weekly log chart below. For, indeed, it was from that Nov’15 low when the bear’s slowdown process began and was ultimately confirmed in Apr’16 when the bear failed to hold late-’15 losses below Nov’14’s 15.04 low.
The extent and impulsiveness of Dec’16/Feb’17’s recovery suggests that Dec’s 15.675 low COMPLETED the B- or 2nd-Wave correction of early-2016’s rally that the market might now be on the verge of resuming. A failure below at least 15-Mar’s 16.825 low is required to threaten this call.
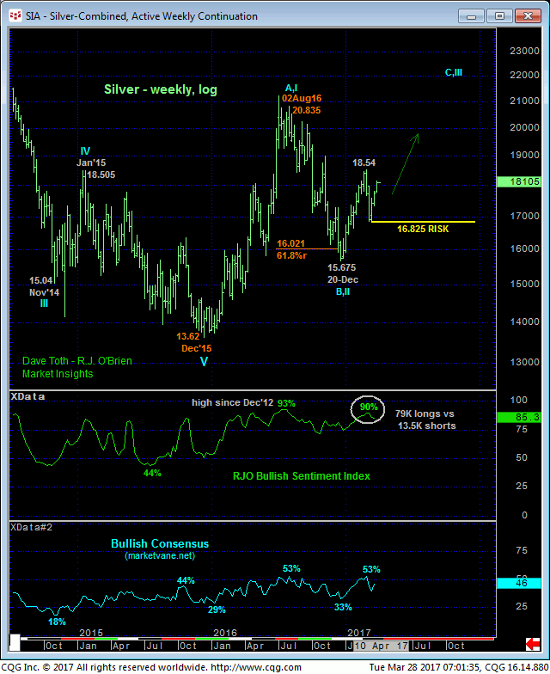
The monthly log scale chart below shows the same long-term base/reversal characteristics (bull divergence in mo, complete 5-wave sequence down from 2011 high & excessive pessimism) that defined the major base/reversal environment in gold and that warns of a resumption of 2016’s uptrend to eventual new highs above last year’s 21.225 high.
In sum a bullish policy is advised for both short- and longer-term traders with weakness below 17.54 deferring this call ahead of further lateral-range consolidation and further weakness below 16.825 negating the call altogether. In lieu of such weakness we anticipate further and possibly accelerated gains with 27-Feb’s 18.54 the key resistant threshold the market needs to break to reaffirm this bullish call and expose potentially sharp gains thereafter.
