JUN GOLD
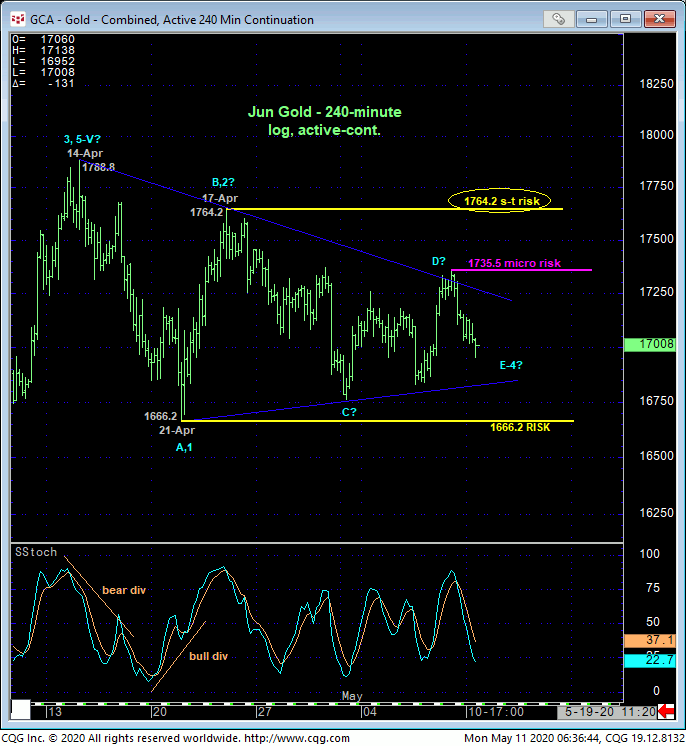
Since 17-Apr’s Technical Blog where we first
warned of a minor bearish divergence in momentum that opened a
correction-vs-reversal debate, the 240-min chart below shows that the market
has traipsed merely laterally. Other than some compressed risk parameters
defined by 21-Apr’s 1666.2 key low that we’ll expound on below
and
recent smaller-degree corrective highs at 1764.2 and 1735.5,
little has changed in this correction-vs-reversal debate, so traders remain
advised to acknowledge and be flexible to either directional outcome.
TO THIS POINT, it’s easy to see the past three weeks’ lateral chop as a textbook example of a lateral (4th-Wave) triangle correction that warns of a (5th-Wave) resumption of the secular bull trend that preceded it. Smaller-degree strength above Fri’s 1735.5 high and micro risk parameter will tilt the odds in favor of this bullish count while commensurately larger-degree strength above 17-Apr’s 1764.2 next larger-degree corrective high will all but confirm it. A relapse below 21-Apr’s 1666.2 low will not only negate this bullish count, but confirm a bearish divergence in daily momentum that would contribute to a peak/reversal threat that could be major in scope.
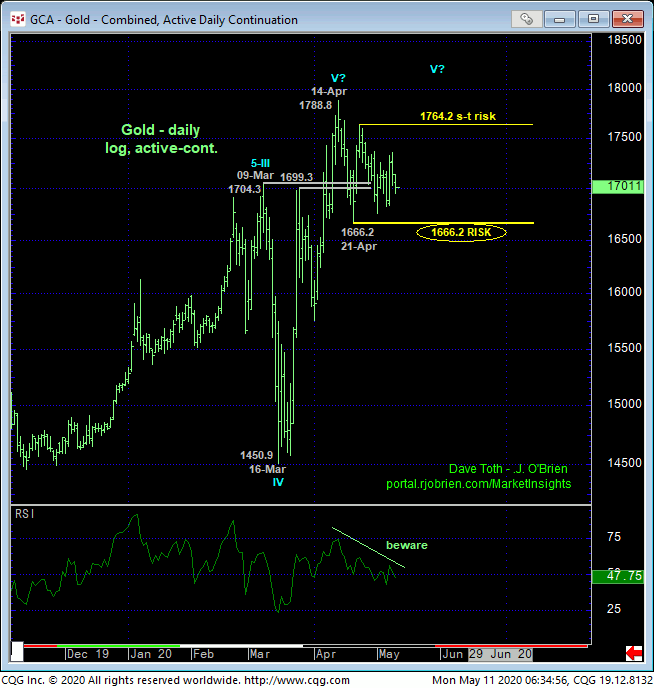
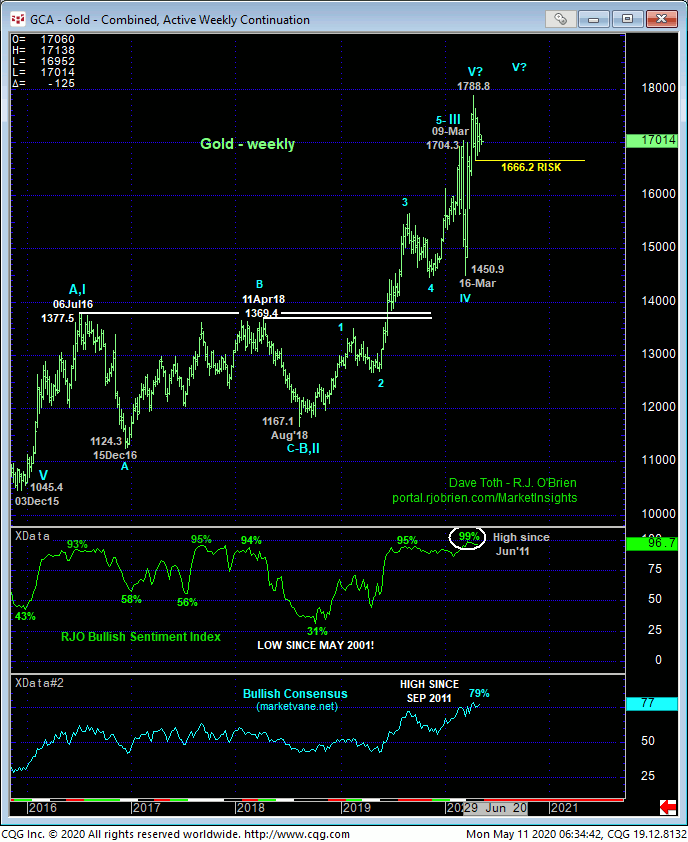
Mar/Apr’s resumption of the secular bull trend is clear in the daily bar chart above. The developing POTENTIAL for a bearish divergence in momentum is equally clear. But this market has yet to CONFIRM the divergence by failing below either a prior corrective low or an initial counter-trend low. 21-Apr’s 1666.2 low serves as that prospective initial counter-trend low, the break below which will confirm the divergence and expose the new longer-term trend as down. And given historically frothy sentiment/contrary opinion conditions, such a move down could be extensive.
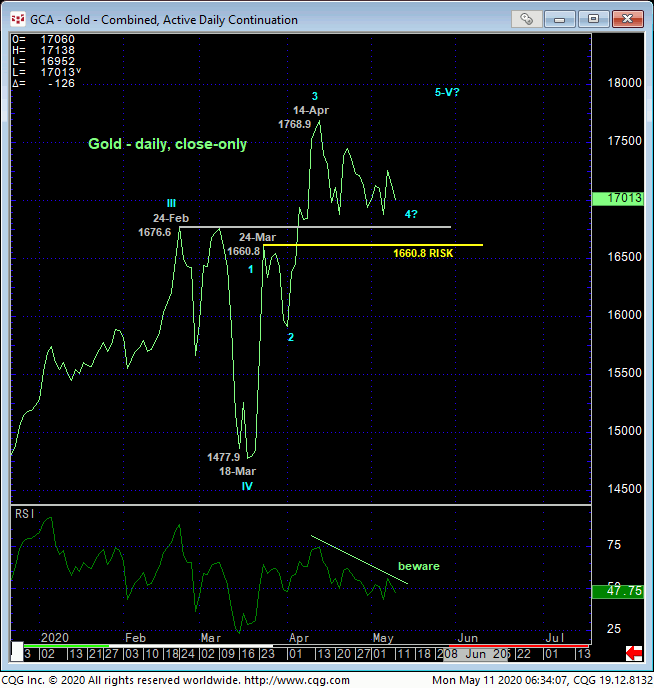
On a daily close-only basis below however, the past three weeks’ lateral chop is thus far unfolding above a goodly amount of former resistance from the 1675-to-1660-area that would be expected to hold as new support IF the secular bull trend is still intact and if the past three weeks’ chop is mere a correction within that bull. A daily close below 1660 would certainly threaten any such bullish count and reinforce a broader peak/reversal count.
Finally, the weekly chart below shows the magnitude of the secular bull market, the understandably frothy bullish sentiment that has been generated and the lack, thus far at least, of the weakness on a scale needed to raise the odds of a peak/reversal-threat environment. These issues considered, a bullish policy remains advised for long-term players with a failure below 1666.2 required to threaten this call enough to warrant moving to at least a neutral policy if not a cautiously bearish one. Shorter-term traders remain OK to approach this market from a cautiously bearish perspective with a recovery above 1735.5 required to threaten this call enough to warrant moving to a neutral/sideline position. In effect, we believe this market has identified 1666.2 and 1764.2 as the key directional triggers heading forward.
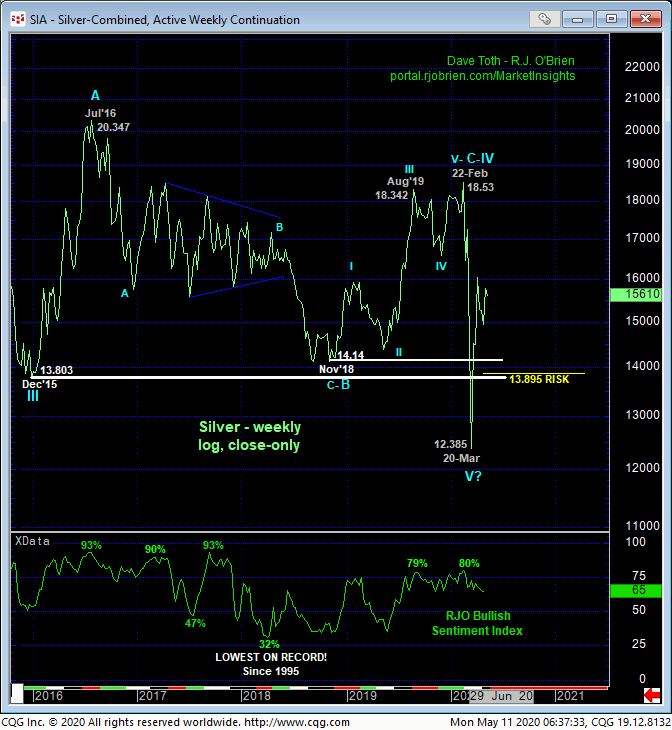
JUL SILVER
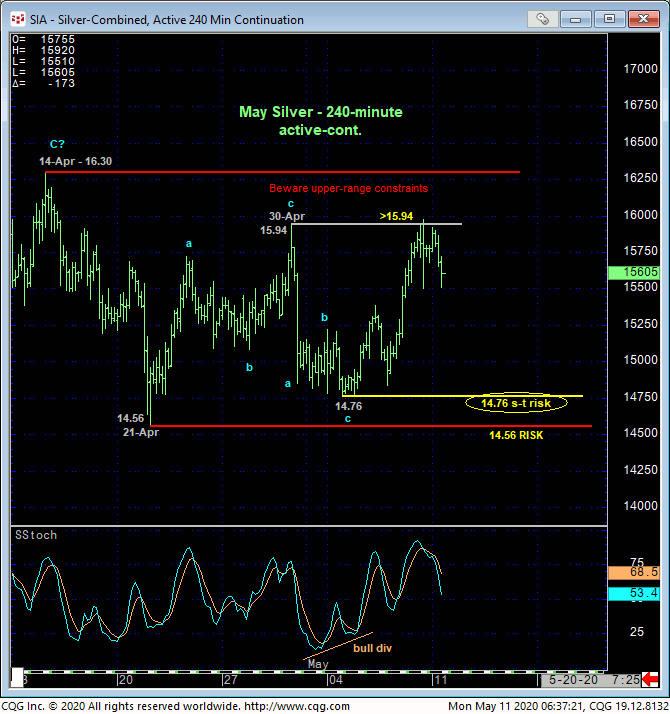
For the most part, the technical construct and expectations for silver and the same as those detailed above in gold with 21-Apr’s 14.56 low and 14-Apr’s 16.30 high defining the boundaries of a correction-vs-reversal range the market needs to break to expose the next key directional move. Fri’s recovery above 30-Apr’s 15.94 high tilts the shorter-term direction higher obviously, leaving 04-May’s 14.76 low in its wake as the end of a 3-wave and thus corrective sell-off attempt from at least that 15.94 high and possibly from 14-Apr’s 16.30 high that, if correct, reinforces a longer-term bullish count to eventual new highs above 16.30.
Commensurately larger-degree weakness below 21-Apr’s 14.56 low is required to confirm a bearish divergence in daily momentum that could expose protracted weakness thereafter. Until weakness below at least 14.76 is proven and on the heels of Mar-Apr’s impressive recovery, he price action from Apr’s 16.30 high thus far looks to be corrective/consolidative ahead of an eventual resumption of Mar-Apr’s uptrend that preceded it.
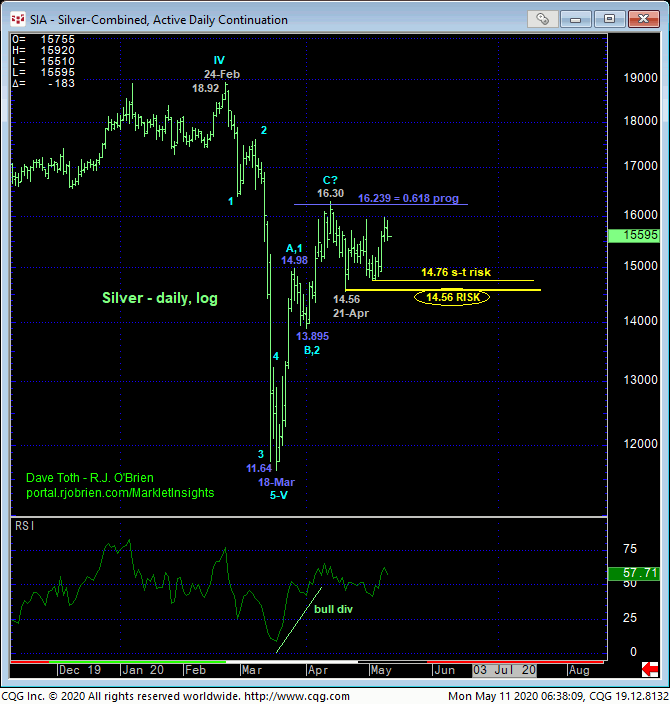
On a much broader scale, it’s hard not to look at the market’s gross failure to sustain Mar’s break to new multi-year lows below the 13.80-to-14.00-area as a positive. This said, the market’s return to merely the middle of the past 4-1/2-YEAR range precludes us from concluding a sustained directional move higher. Indeed, the middle-half bowels of this range produced tons of not unexpected whipsaw behavior over these past few years and further such behavior would hardly come as a surprise. Per such and on this larger-degree scale, the risk/reward merits of directional exposure are considered poor, warranting a more conservative approach to risk assumption. And herein lies the importance of identifying tighter but objective risk parameters like 14.76 and 14.56.
These issues considered as well as the market’s position around the upper-quarter of the recent 16.30 – 14.56-range that presents poor risk/reward merits for shorter-term bulls, a neutral-to-cautiously-bullish policy remains advised for longer-term players with a failure below 14.56 required to negate this call and warrant its immediate cover. A neutral/sideline policy is advised for shorter-term traders with tighter risk profiles.
