SEP SILVER
We’re starting with silver because of yesterday and today’s explosive, accelerating, extending reaffirmation of the secular reversal from 18-Mar’s 11.64 low and end to the secular bear market from Apr 2011’s 49.82 all-time high. This week’s impressive continuation of the bull is best displayed in the 240-min chart below that shows the market’s definition of Fri’s 19.355 low as the latest smaller-degree corrective low this market is now minimally required to fail below to even defer, let alone threaten the major uptrend. Per such, this 19.355 level serves as our new short-term risk parameter from which shorter-term traders with tighter risk profiles can objectively rebase and manage the risk of a still-advised bullish policy and exposure.
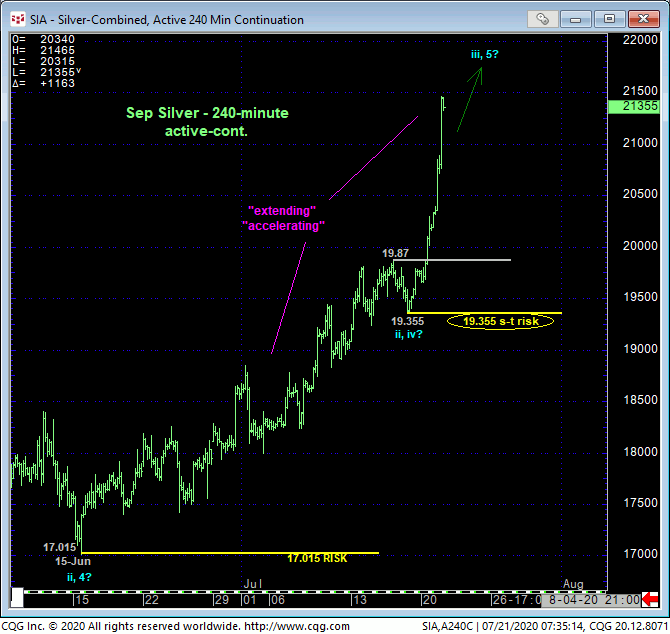
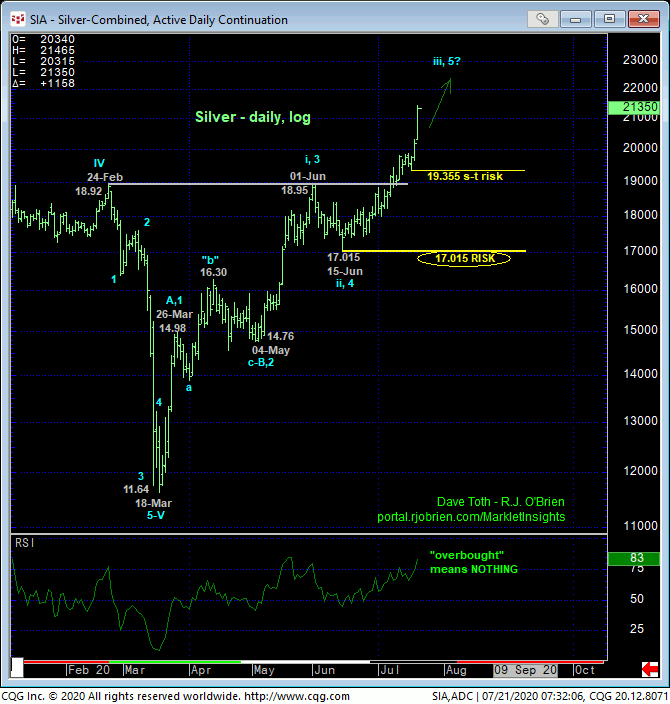
Given the accelerated nature of this week’s continuation of the new secular bull market, we have to entertain what would be an extraordinarily bullish count that contends the rally from 15-Jun’s 17.015 low is not the completing 5th-Wave of an Elliott sequence from 18-Mar’s 11.64 low, but rather an “extending” 3rd-Wave from 04-May’s 14.76 low. If correct, steep, relentless gains straight away to the 24-to-28-range would not surprise.
This daily chart above is also the latest poster-child reminder of the total uselessness and gross error in ever referring to such a trend as “overbought”. Such references are ignorant of momentum as a technical tool and thus outside the bounds of technical discipline as the momentum “tail” never, ever wags the underlying market “dog”.
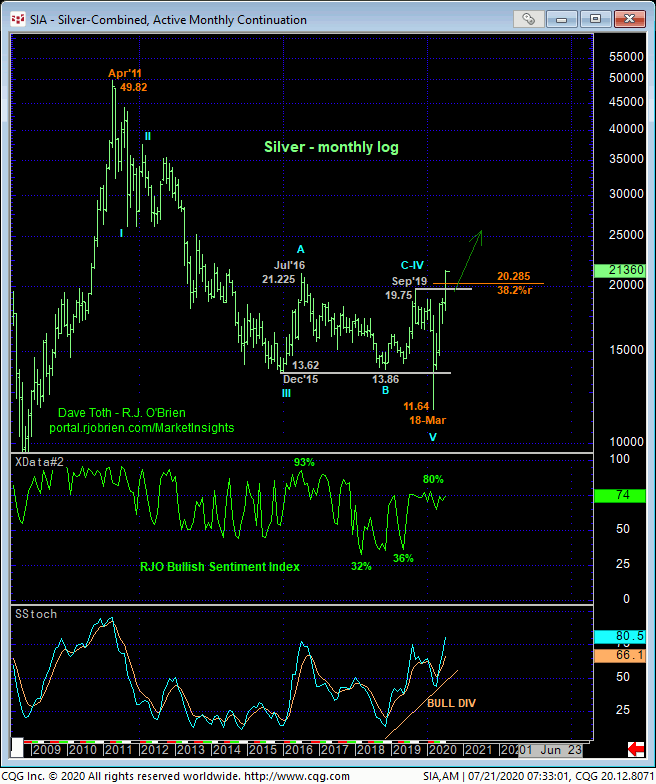
From an even more historic perspective, the monthly log chart below shows a confirmed bullish divergence in MONTHLY momentum that, in fact, breaks the 9-year secular bear market and starts a major correction or reversal higher. Given that a relatively positively correlated gold market is nearing its 2011 all-time high, perhaps this week’s accelerated rally is this market’s warning that it’s time to play catch-up with its precious metal cousin. And it’s easy to see the mountains of upside potential between spot and 2011 highs near $50.
These issues considered, a bullish policy and exposure remain advised with a failure below 19.355 required to defer or threaten this call enough to warrant paring or neutralizing exposure commensurate with one’s personal risk profile. In lieu of such weakness, further and possibly explosive gains straight away should not surprise.
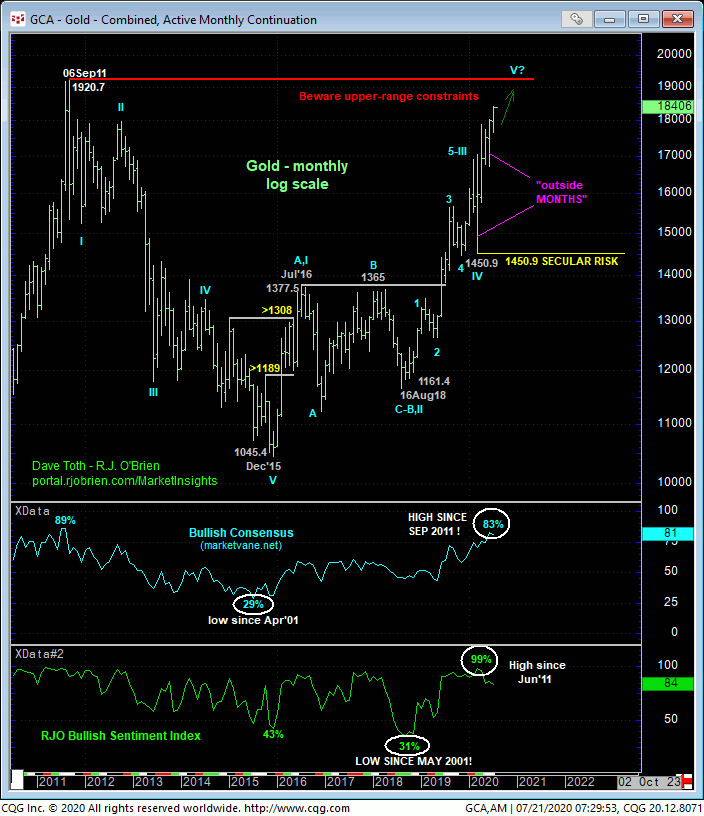
AUG GOLD
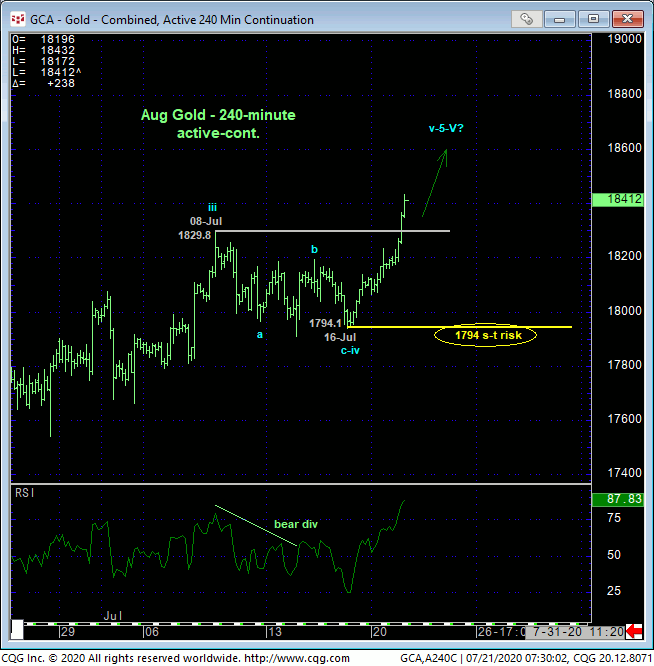
Today’s break above 08-Jul’s 1829.8 high reaffirms the major bull trend and leaves Thur’s 1794.1 low in its wake as the latest smaller-degree corrective low this market is now minimally required to fail below to confirm a bearish divergence in momentum and expose an interim corrective setback. Per such, we’re identifying 1794 as our new short-term risk parameter from which a still-advised bullish policy ad exposure can be objectively rebased and managed by shorter-term traders with tighter risk profiles.
Former 1830-to-1820-area resistance would be expected to hold as new near-term support.
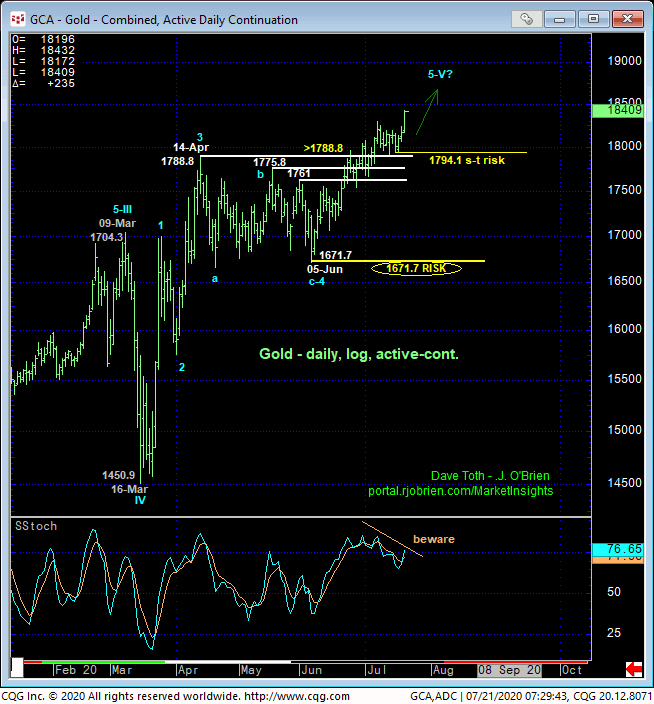
The daily log scale chart above shows the developing POTENTIAL for a bearish divergence in momentum, but this indicator won’t be considered CONFIRMED to the point of non-bullish action like long-covers until and unless the market proves weakness below 1794 needed to, in fact, break the uptrend from 05-Jun’s 1671.7 next larger-degree corrective low and key long-term risk parameter. And even if the market did fail short-term below 1794, it would still only be engaging an absolute ton of former THREE MONTH resistance-turned-support from the 1788-to-1761-range.
Herein lies the technical and trading importance of SCALE as commensurately larger-degree weakness below 05-Jun’s 1671.7 larger-degree corrective low remains required to break the broader uptrend from 16-mar’s 1450.9 low, let alone the secular bull market from Aug’18’s 1161 low.
These risk parameters will come in handy however as the market nears its all-time high of 1920 posted in Sep 2011. If there’s a time and place to beware a peak/correction/reversal threat, it is here and now. BUT we can objectively gauge such an environment by whether or not the market sustains gains above 1794 initially, the 1760-area and then 1671. Until and unless such weakness is proven, there is no way to know that this market isn’t on a tangent to blow away 2011’s 1920 high and reach indeterminably higher levels thereafter.
In sum, a bullish policy and exposure remain advised with a failure below at least 1794 required to defer or threaten this call enough to warrant defensive measures commensurate with one’s personal risk profile. In lieu of such weakness, further and possibly accelerated gains remain expected.
